Understanding how people find and interact with your website is one of the most important capabilities any marketer or founder can develop. Whether you're validating product-market fit, measuring the ROI of a content campaign, or identifying which channels drive the most qualified visitors, knowing how to see website traffic gives you the data foundation for every growth decision you make.
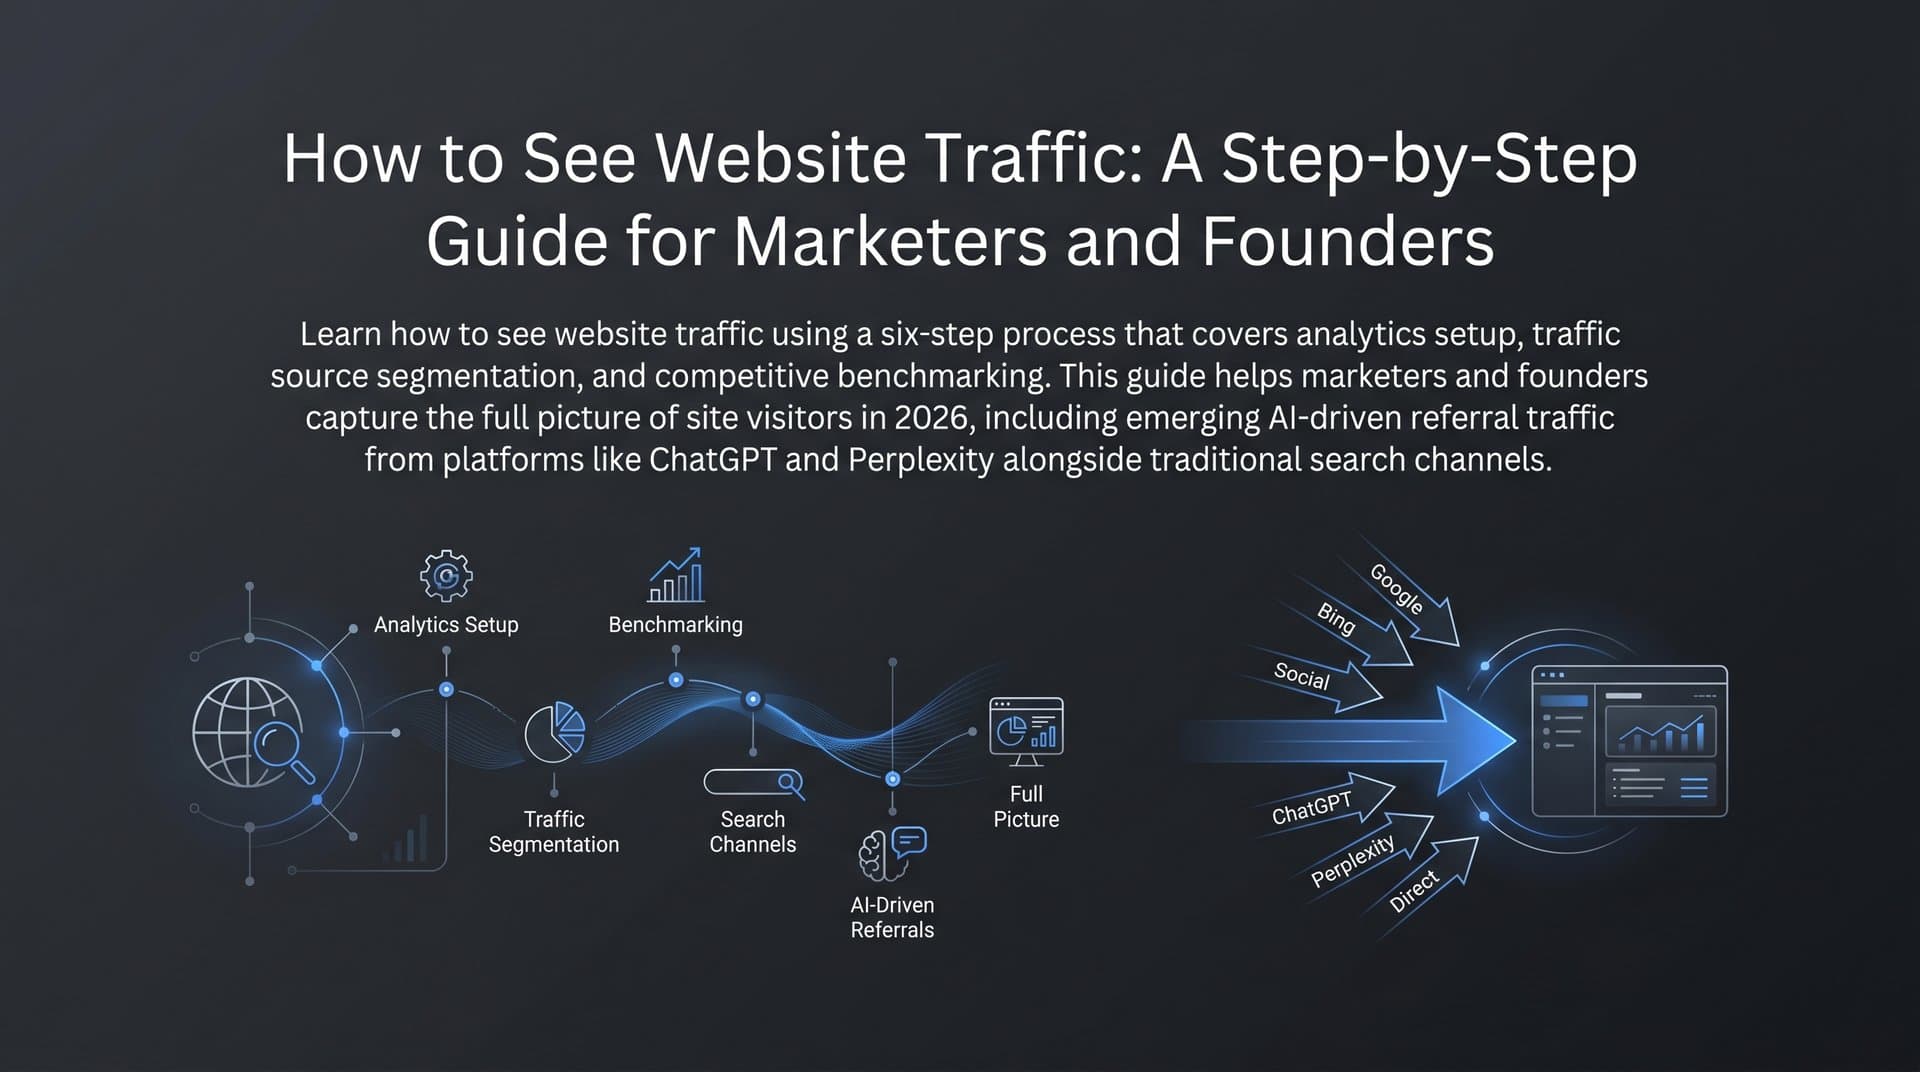
But traffic analysis in 2026 goes far beyond checking a single dashboard. Traditional search traffic is now joined by AI-driven referral traffic from platforms like ChatGPT, Perplexity, and Claude, meaning you need a broader lens to capture the full picture of how users discover your brand.
This guide walks you through six concrete steps to set up, access, and interpret your website traffic data using both free and professional tools. By the end, you'll know how to install analytics tracking, read key traffic reports, segment visitors by source, benchmark against competitors, track your visibility inside AI search engines, and turn raw data into an actionable growth plan.
Let's get started.
Step 1: Install and Configure Google Analytics 4 on Your Site
Before you can see website traffic, you need a reliable way to collect it. Google Analytics 4 is the current standard for web analytics. Universal Analytics was fully sunset, and GA4 now uses an event-based data model that gives you more granular insights into how users actually engage with your content.
Here's how to get it installed correctly from the start.
Create your GA4 property: Log into your Google Analytics account at analytics.google.com, click "Admin," then "Create Property." Name it after your website, select your industry and reporting time zone, and follow the prompts to set up a web data stream by entering your domain URL.
Add the tracking tag to your site: You have two main options. The first is Google Tag Manager, which is the recommended approach for most marketers and founders because it lets you manage all your tracking scripts in one place without touching code. Install the GTM container snippet on your site, then add GA4 as a tag inside GTM. The second option is direct code injection, where you paste the GA4 measurement ID script directly into the <head> section of your site's HTML. Most website platforms like Webflow, WordPress, and Shopify have dedicated fields for this.
Configure your key settings: Once the tag is live, head into your GA4 property settings and enable Enhanced Measurement. This automatically tracks events like scroll depth, outbound link clicks, file downloads, and video engagement without any additional coding. Next, link your Google Search Console account to GA4 by going to Admin > Property Settings > Search Console Links. This connection is essential for understanding which organic search queries drive traffic to specific pages.
Verify the tag is firing: Open your website in Chrome and use the Tag Assistant extension from Google to confirm your GA4 tag is loading correctly. Then open GA4 and navigate to Reports > Realtime. If you see yourself as an active user, the tag is working. If your site isn't appearing in search results at all, you may also want to learn how to add a website on Google to ensure proper registration.
Common pitfall to avoid: Many teams forget to exclude their own office or home IP addresses from GA4 data. When your team browses your own site, those sessions inflate your traffic numbers and skew your engagement metrics. Go to Admin > Data Streams > Your Stream > Configure Tag Settings > Define Internal Traffic, and add your IP ranges there.
Success indicator: You should see live visitor activity in the Realtime overview within minutes of installation. If you see your own session reflected, you're collecting data correctly.
Step 2: Navigate Your First Traffic Overview Report
Now that GA4 is collecting data, it's time to find the reports that actually tell you how people are reaching your site. The good news is that the core traffic data lives in one primary location.
Go to Reports > Acquisition > Traffic Acquisition. This is your home base for understanding how visitors arrive on your website.
Understanding the key metrics: GA4 replaced the old Universal Analytics metric set with a new framework built around engagement. Here's what each metric means in practice. For a deeper dive into which numbers matter most, check out our guide on key website metrics to track.
Users: The number of unique individuals who visited your site in the selected period. GA4 uses a blended identity model that attempts to de-duplicate users across devices.
Sessions: The number of distinct visits to your site. One user can generate multiple sessions.
Engaged Sessions: Sessions where the user was active for at least 10 seconds, viewed more than one page, or triggered a conversion event. This is a more meaningful quality signal than raw sessions.
Engagement Rate: The percentage of sessions that were engaged sessions. This replaced bounce rate as the primary quality indicator. A higher engagement rate means more of your visitors are actually consuming your content.
Average Engagement Time: How long, on average, users were actively engaged with your site during their sessions. This is a more accurate reflection of attention than time-on-page was in Universal Analytics.
Adjusting date ranges and spotting trends: Use the date picker in the top-right corner of GA4 to adjust your reporting window. The comparison feature is particularly useful: select "Compare" and choose "Previous Period" to instantly see week-over-week or month-over-month changes. This makes it easy to spot whether a traffic dip is a real trend or just a weekend anomaly.
Reading the channel breakdown: The Traffic Acquisition report groups visitors into channel categories: Organic Search, Direct, Referral, Social, Email, Paid Search, and others. Understanding the difference between direct traffic vs organic search is critical for interpreting these groupings correctly. Pay attention to the "Referral" channel, as this is where you'll start seeing traffic from domains like chatgpt.com and perplexity.ai as AI-driven referrals grow.
Pro tip: Save a custom comparison for "Current Month vs. Previous Month" as a shortcut in your GA4 navigation. It saves time during your regular traffic reviews and keeps your analysis consistent.
Step 3: Segment Traffic by Source, Medium, and Landing Page
The channel groupings in the Traffic Acquisition report are a useful starting point, but they're too broad to drive specific decisions. The real insights come when you drill down into source and medium and connect that data to landing page performance.
Using the source/medium report: Inside GA4, navigate to Reports > Acquisition > Traffic Acquisition, then change the primary dimension from "Session default channel group" to "Session source/medium." Now you'll see granular breakdowns like google/organic, linkedin/referral, newsletter/email, and increasingly, entries like chatgpt.com/referral or perplexity.ai/referral. These specific source/medium combinations tell you exactly which platforms and campaigns are driving visitors.
Building explorations to connect source with landing pages: GA4's Explore section (the compass icon in the left navigation) lets you build custom reports that standard views can't show. Create a free-form exploration with "Session source/medium" as one dimension and "Landing page + query string" as another. This cross-reference tells you not just where traffic comes from, but which specific pages those visitors land on. That's the combination that drives real content decisions.
Why landing page analysis matters: Your traffic overview might show healthy overall numbers, but if 80% of your sessions are landing on a single blog post from two years ago, your content portfolio has concentration risk. Landing page analysis reveals your top performers, your underperformers, and the pages that receive high traffic but generate low engagement, which are prime candidates for improving website conversion rates.
Filtering for organic traffic specifically: To measure your SEO performance in isolation, apply a filter in your exploration or traffic report for "Session medium exactly matches organic." This gives you a clean view of how your search engine optimization efforts are performing without paid or social traffic diluting the picture. For a comprehensive understanding of what this data means, read our explainer on organic traffic in Google Analytics.
Connecting data to content strategy: Once you identify which topics and pages drive engaged organic traffic, you have a clear signal for where to invest your content production resources. Double down on topic clusters that are already working. Revisit pages with high traffic but low engagement rates, as those often need better formatting, stronger calls to action, or more substantive content.
Step 4: Check Competitor Website Traffic with Third-Party Tools
Your own GA4 data tells you what's happening on your site. But to understand your position in the market, you also need to know how your traffic compares to competitors and where they're winning traffic that you're not capturing yet. For a detailed walkthrough of estimating competitor numbers, see our guide on how to see how much traffic a site gets.
Three tools dominate this space, and each has a distinct strength.
Semrush: Best for keyword-level competitive analysis. Enter a competitor's domain and you'll see estimated organic traffic, top keywords, paid search activity, and their highest-traffic pages. Semrush is particularly strong for identifying keyword gaps, which are terms your competitors rank for that you don't yet target.
Ahrefs: Known for its backlink database and content explorer. Ahrefs' Site Explorer gives you estimated organic traffic alongside the pages and keywords driving it. Its "Top Pages" report is especially useful for identifying which competitor content pieces are generating the most search traffic.
SimilarWeb: Provides a broader view of total traffic across all channels, including direct, social, referral, and paid, rather than focusing purely on organic search. This makes it useful for understanding a competitor's full traffic mix, not just their SEO footprint. You can also explore dedicated organic traffic growth tools that combine competitive analysis with AI-powered optimization.
An important caveat: All third-party traffic estimates are modeled approximations, not exact figures. These tools use panel data, web crawls, and statistical modeling to produce estimates that can vary meaningfully from actual traffic. Treat these numbers as directional benchmarks for relative comparison, not as ground truth. If Semrush estimates a competitor gets roughly three times your organic traffic, that's a meaningful signal. If the estimate differs by a few thousand visits, don't over-index on the precision.
Finding competitor content gaps: In Semrush, use the Keyword Gap tool to compare your domain against two or three competitors simultaneously. The tool highlights keywords your competitors rank for that you don't. Sort by search volume and difficulty to find the most accessible opportunities. These gaps often represent entire topic areas your content strategy hasn't addressed yet.
Turning insights into opportunities: Export your top competitor content gaps and map them to your editorial calendar. Each gap is a potential article, guide, or landing page that could capture traffic currently going to a competitor. Prioritize topics that align with your product's value proposition so the traffic you attract is relevant, not just voluminous.
Step 5: Track AI Search Visibility — The Traffic You Can't See in GA4
Here's a reality that most traffic guides don't address: a growing portion of brand discovery is happening in places that GA4 simply cannot see.
When someone asks ChatGPT "what's the best tool for tracking AI brand mentions?" or asks Perplexity "which SEO platforms support GEO optimization?", the AI model may respond with a recommendation, a comparison, or a summary that mentions your brand. In many cases, the user gets their answer directly from the AI without ever clicking through to your website. No session is recorded. No referral appears in your acquisition report. The discovery happened, but your analytics saw nothing.
This is the zero-click AI mention problem, and it's becoming increasingly significant as AI-powered search continues to grow in adoption. Understanding how ChatGPT ranks websites can help you optimize for this new discovery channel.
Why this matters for brand growth: Even when a user doesn't click through immediately, being mentioned positively by an AI model shapes brand perception and purchase consideration. A founder who hears your brand recommended by Claude three times over a month is far more likely to eventually visit your site and convert. Traditional analytics captures the eventual click, but misses the entire discovery journey that preceded it.
How AI visibility tracking works: Rather than waiting for a user to click through to your site, AI visibility monitoring proactively queries AI models with prompts relevant to your industry and tracks whether and how your brand appears in the responses. This includes monitoring sentiment, the context in which your brand is mentioned, and how your visibility compares to competitors across different query types. Our deep dive on organic traffic from AI search explains how to make ChatGPT and Claude recommend your brand.
Sight AI's approach to this problem: Sight AI's AI Visibility tracking monitors brand mentions across 6+ AI platforms, including ChatGPT, Claude, and Perplexity. It provides an AI Visibility Score that aggregates your brand's presence across platforms, along with sentiment analysis to understand whether mentions are positive, neutral, or negative. The prompt tracking feature shows you which types of queries trigger mentions of your brand, which is invaluable for understanding where your brand has authority in AI models' knowledge and where gaps exist.
The complete traffic picture: Think of GA4 as capturing the traffic you can measure directly, and AI visibility tracking as capturing the brand discovery you can't. Both matter for growth. A brand that appears frequently and positively in AI responses will, over time, see that reflected in direct traffic, branded search volume, and referral traffic as users who discovered the brand through AI eventually make their way to the site.
Actionable step: Set up AI visibility monitoring alongside GA4 so you have both layers of data running simultaneously. When you launch a new content campaign or publish a comprehensive guide, track both the traditional traffic response in GA4 and the AI visibility response to see whether the content is improving how AI models reference your brand.
Step 6: Turn Traffic Data into a Content Growth Plan
Data without action is just noise. The final step is building a system that converts your traffic insights into a predictable content growth engine.
Establish a traffic analysis cadence: Consistency matters more than depth in any single session. A simple cadence that works well looks like this.
Weekly quick check (15 minutes): Review the GA4 Realtime report and the past 7-day traffic acquisition summary. Look for unexpected spikes or drops. If something unusual appears, investigate the source before the week closes. A dedicated website traffic monitoring tool can automate alerts so you never miss a significant change.
Monthly deep dive (60-90 minutes): Pull your full acquisition report, segment by source/medium, review landing page performance, and check your AI visibility dashboard for changes in mention frequency or sentiment. Compare month-over-month to identify trends.
Quarterly strategy review (half day): Run a full competitor analysis using Semrush or Ahrefs, review your keyword gap report, assess your AI visibility score trajectory, and rebuild your content calendar for the next quarter based on what the data is telling you.
Identifying content opportunities from your data: Three data sources consistently surface the best content opportunities.
Search Console high-impression/low-click pages: In Google Search Console, look for pages that appear frequently in search results (high impressions) but receive few clicks (low CTR). These pages have search demand but weak title tags or meta descriptions. Updating these can generate traffic gains without creating new content.
Top AI-mentioned topics: Your AI visibility tracking will show which topic areas trigger brand mentions most frequently. These topics represent your brand's current authority zones in AI models. Create more content in these areas to reinforce that authority, and identify adjacent topics where you're not yet being mentioned.
Competitor content gaps: The keyword gap analysis from Step 4 feeds directly into your content calendar. Each gap is a content brief waiting to be written.
Scaling content production with AI tools: Once you have a list of content opportunities, the bottleneck becomes production speed. Sight AI's content writer uses 13+ specialized AI agents to produce SEO and GEO-optimized articles, including listicles, step-by-step guides, and explainers. The Autopilot Mode can handle the research, drafting, and optimization of articles at scale, so your team focuses on strategy and review rather than writing from scratch.
Getting new content indexed fast: Publishing content is only half the battle. Search engines need to discover and index it before it can rank. Learning how to speed up website indexing ensures your new pages start competing in search results within hours, not weeks. Sight AI's IndexNow integration automatically notifies multiple search engines the moment new content is published, and automated sitemap updates ensure your full content library is always accurately represented.
Success indicator: You've completed this step when you have a documented content calendar for the next 90 days, with each planned piece tied to a specific traffic data signal: a keyword gap, a high-impression/low-click page, a competitor's top content, or an AI visibility opportunity. That's content strategy driven by data, not guesswork.
Your Complete Traffic Visibility Checklist
Seeing your website traffic clearly is the starting point for every smart growth decision. Before you move on, run through this checklist to confirm you've completed each step.
1. GA4 is installed and verified, with Realtime data flowing and internal IP addresses excluded.
2. You can navigate the Traffic Acquisition report, understand the key engagement metrics, and compare date ranges to spot trends.
3. You've segmented traffic by source/medium and identified your top landing pages using GA4 Explorations.
4. You've benchmarked against at least two competitors using Semrush, Ahrefs, or SimilarWeb, and documented your keyword content gaps.
5. You've set up AI visibility tracking to capture brand mentions across AI platforms that GA4 cannot see.
6. You've translated your traffic insights into a documented content plan with a clear 90-day calendar.
The landscape of "website traffic" is broader than it's ever been. Traditional organic clicks still matter, and GA4 remains the essential tool for measuring them. But AI-driven brand discovery is growing rapidly, and the brands that will win the next phase of organic growth are the ones building visibility across both traditional search and AI platforms simultaneously.
By combining analytics tools like GA4 with AI visibility platforms, you'll have the complete picture and the content engine to act on it. Start tracking your AI visibility today and see exactly where your brand appears across top AI platforms, so you're never flying blind on how AI models like ChatGPT and Claude are talking about you.