Understanding how much traffic a website receives is one of the most fundamental skills in digital marketing. Whether you're sizing up a competitor, evaluating a potential partnership, vetting a domain acquisition, or simply benchmarking your own site's performance, traffic data tells you what's working and where the real opportunities are hiding.
But here's the challenge: no single tool gives you the complete picture. Google Analytics shows your own site's data with precision, but it won't reveal a competitor's numbers. Third-party estimators can approximate any site's traffic, but their accuracy varies considerably. And in 2026, with AI-driven search reshaping how users discover content, traditional traffic metrics only capture part of the story.
You also need to understand how AI models are surfacing your brand. Or ignoring it entirely.
This guide walks you through a practical, repeatable process to see how much traffic any site gets, whether it's your own domain or a competitor's. You'll learn how to pull accurate first-party data, cross-reference third-party estimates, break down traffic by source and channel, analyze the keywords driving organic visits, and extend your analysis into AI visibility, which is quickly becoming a critical traffic driver that most marketers are still overlooking.
By the end, you'll have a reliable workflow you can apply to any domain, any time.
Step 1: Pull First-Party Data from Google Analytics and Search Console
If the site you're analyzing is your own, start here. First-party data is the gold standard because it comes directly from your own tracking implementation, with no estimation involved. Google Analytics 4 (GA4) and Google Search Console give you two complementary views of your traffic that, when combined, paint a very accurate picture.
Navigating GA4 for Total Traffic: Log into your GA4 property and head to Reports in the left sidebar. Under the "Life cycle" section, open "Acquisition" and then "Traffic Acquisition." This report shows you sessions broken down by channel group, so you can see total traffic and how it's distributed across organic search, direct, referral, social, and paid at a glance. If you're new to understanding organic traffic in Google Analytics, it's worth familiarizing yourself with how GA4 categorizes and reports on these channels. For raw user and pageview counts, check the "Overview" report under Acquisition. Set your date range to whatever window you're analyzing, whether that's the last 30 days, a quarter, or year-over-year comparisons.
Using Search Console for Organic Performance: Google Search Console is free, directly from Google, and specifically focused on organic search visibility. Log in at search.google.com/search-console and open the "Performance" report. Here you'll find impressions (how many times your pages appeared in search results), clicks (how many people actually visited), click-through rate, and average position for every keyword and page on your site. This data is essential for understanding your organic search footprint beyond what GA4 shows.
Key Reports to Check: In GA4, your go-to reports are Traffic Acquisition (channel-level sessions), Landing Pages (which pages drive the most entrances), and the Engagement overview (to understand what visitors do once they arrive). In Search Console, focus on the Performance report filtered by "Pages" to see which URLs get the most organic clicks, and by "Queries" to see which keywords are driving traffic. Knowing which key website metrics to track ensures you're focusing on the data points that actually matter.
Quick Verification Step: Compare your GA4 organic search sessions against your Search Console clicks for the same date range. They won't match exactly because of how each platform attributes sessions, but they should be directionally consistent. If Search Console shows significantly more clicks than GA4 shows organic sessions, you may have a tracking gap, perhaps pages missing the GA4 tag or bot traffic filtering differences. Spotting this early prevents you from making decisions based on incomplete data.
First-party data is your baseline. Everything else in this process layers on top of it. When you're analyzing a competitor's site, you won't have this luxury, which is where the next step comes in.
Step 2: Estimate Any Site's Traffic with Third-Party Tools
When you want to see how much traffic a site gets and that site isn't yours, you need third-party estimation tools. These platforms use various methodologies to approximate traffic for virtually any domain, and they're indispensable for competitive research.
The Main Tools to Know: SimilarWeb, SEMrush, and Ahrefs are the three most widely used platforms for traffic estimation. SimilarWeb is particularly strong for total traffic estimates and channel breakdowns, using a combination of clickstream panel data and web crawling. SEMrush and Ahrefs are especially powerful for organic search traffic estimates, deriving their numbers primarily from keyword ranking data combined with estimated search volumes. For free alternatives, Ubersuggest offers basic traffic estimates, and Google's own tools (like the Keyword Planner) can help you triangulate organic traffic for specific keywords.
How These Estimates Are Generated: Understanding the methodology helps you interpret the numbers correctly. Clickstream panel data means the tool aggregates anonymized browsing behavior from a large sample of internet users and extrapolates to the broader population. Search volume modeling means the tool looks at which keywords a site ranks for, estimates how much traffic each keyword sends based on search volume and the site's position, and adds it up. Both approaches have inherent limitations. Panel data skews toward certain demographics and regions. Keyword-based estimates miss branded traffic, direct navigation, and referral visits.
Step-by-Step: Reading a Traffic Overview: In SimilarWeb, enter a competitor's domain in the search bar and navigate to the "Website Analysis" section. You'll see total visits for the selected period, average visit duration, pages per visit, and a channel breakdown. In SEMrush, use the "Domain Overview" tool and look at the "Organic Traffic" figure, which represents estimated monthly visits from organic search. In Ahrefs, the "Site Explorer" tool shows "Organic Traffic" as the primary metric, calculated from keyword rankings.
The Accuracy Reality: Tools often show meaningfully different estimates for the same domain, sometimes by a factor of two or more. This isn't a bug; it's a reflection of different methodologies. The right approach is to cross-reference at least two tools and look for directional trends rather than treating any single number as ground truth. Before diving into competitor analysis, make sure your own site is properly discoverable by confirming it's indexed; you can check if your website is indexed to rule out any foundational visibility issues.
Use these tools to understand relative performance and trends. Is a competitor's traffic growing or declining? Which channels are strongest? That directional intelligence is where the real value lies.
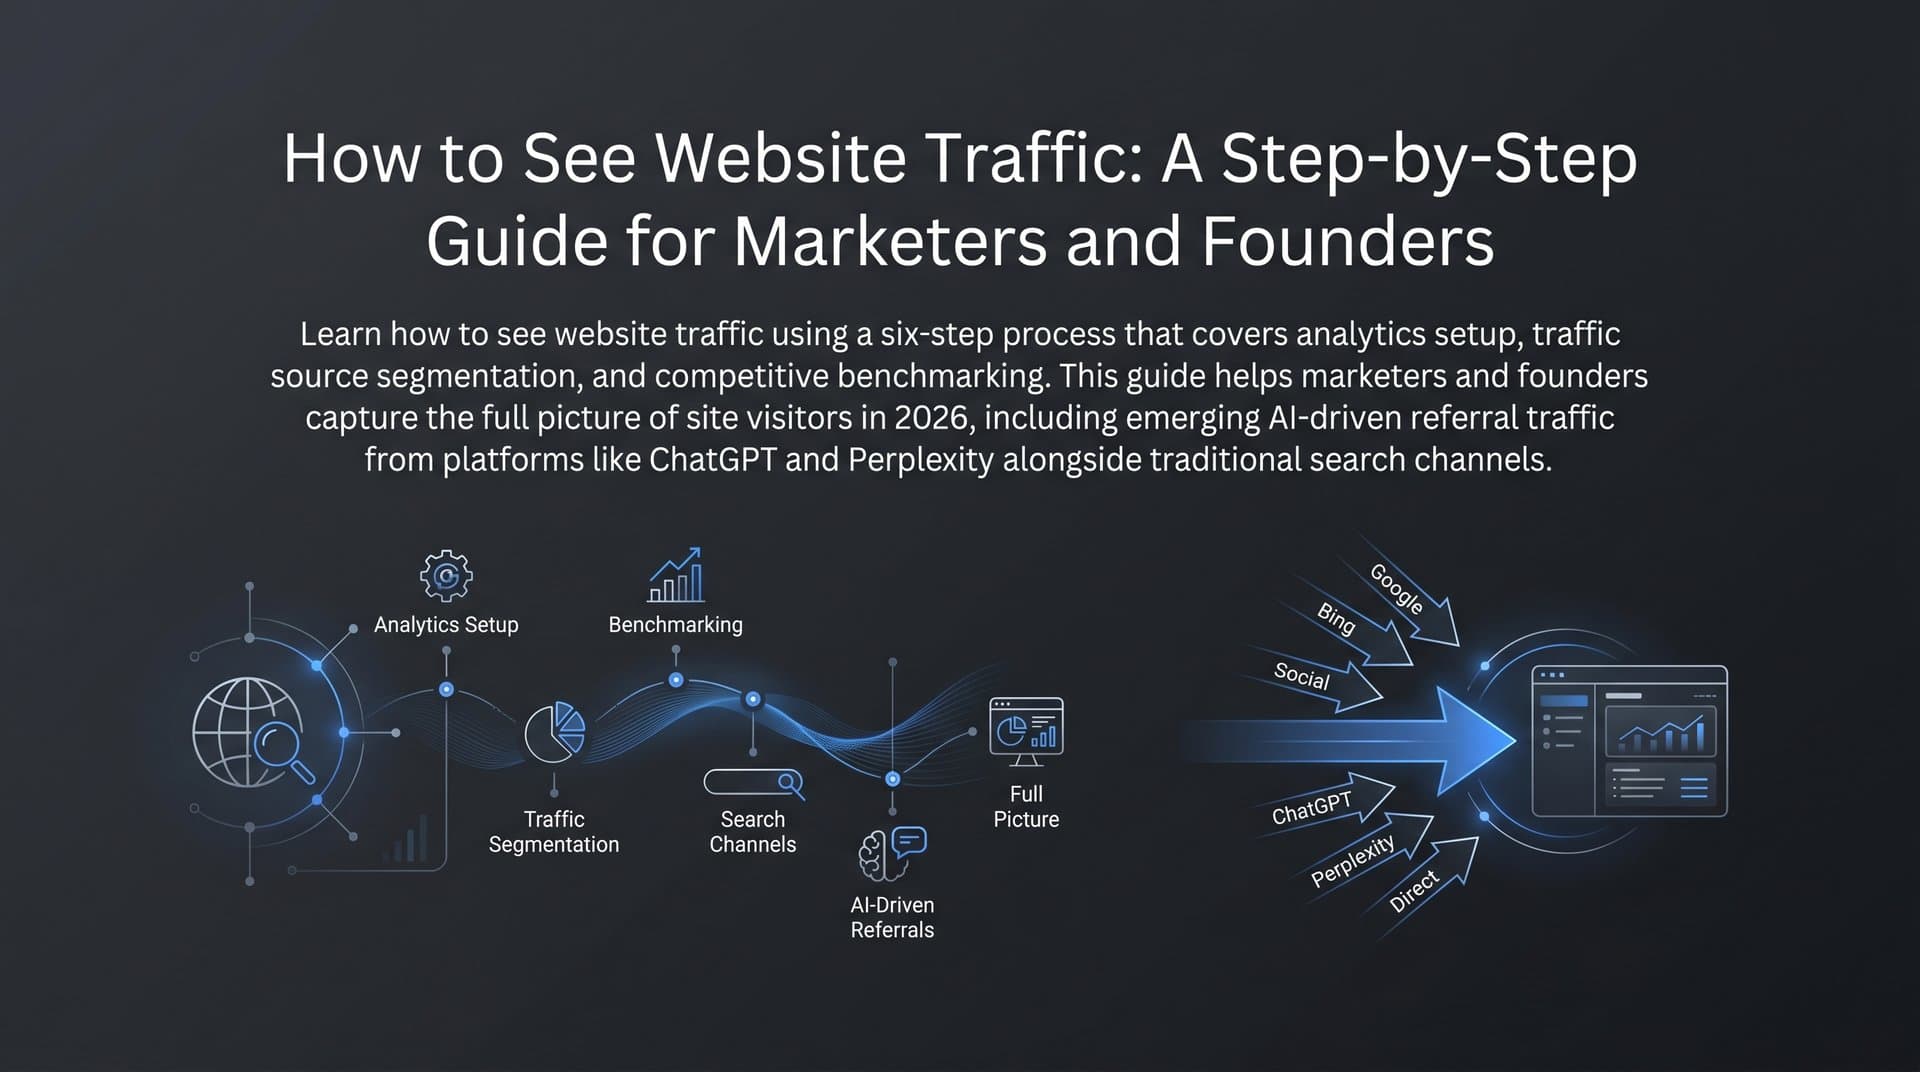
Step 3: Break Down Traffic by Source and Channel
Total traffic numbers are almost always misleading on their own. A site receiving 200,000 monthly visits powered almost entirely by paid advertising is a fundamentally different business than one receiving 200,000 visits from organic search. Channel-level analysis is where traffic data becomes genuinely actionable.
The Five Core Channels: Every traffic analysis should account for these five sources.
Organic Search: Visitors who found the site through unpaid search results on Google, Bing, or other search engines. This is the channel most influenced by SEO and content strategy.
Direct: Visitors who typed the URL directly or arrived through bookmarks. High direct traffic often signals strong brand awareness or a loyal returning audience.
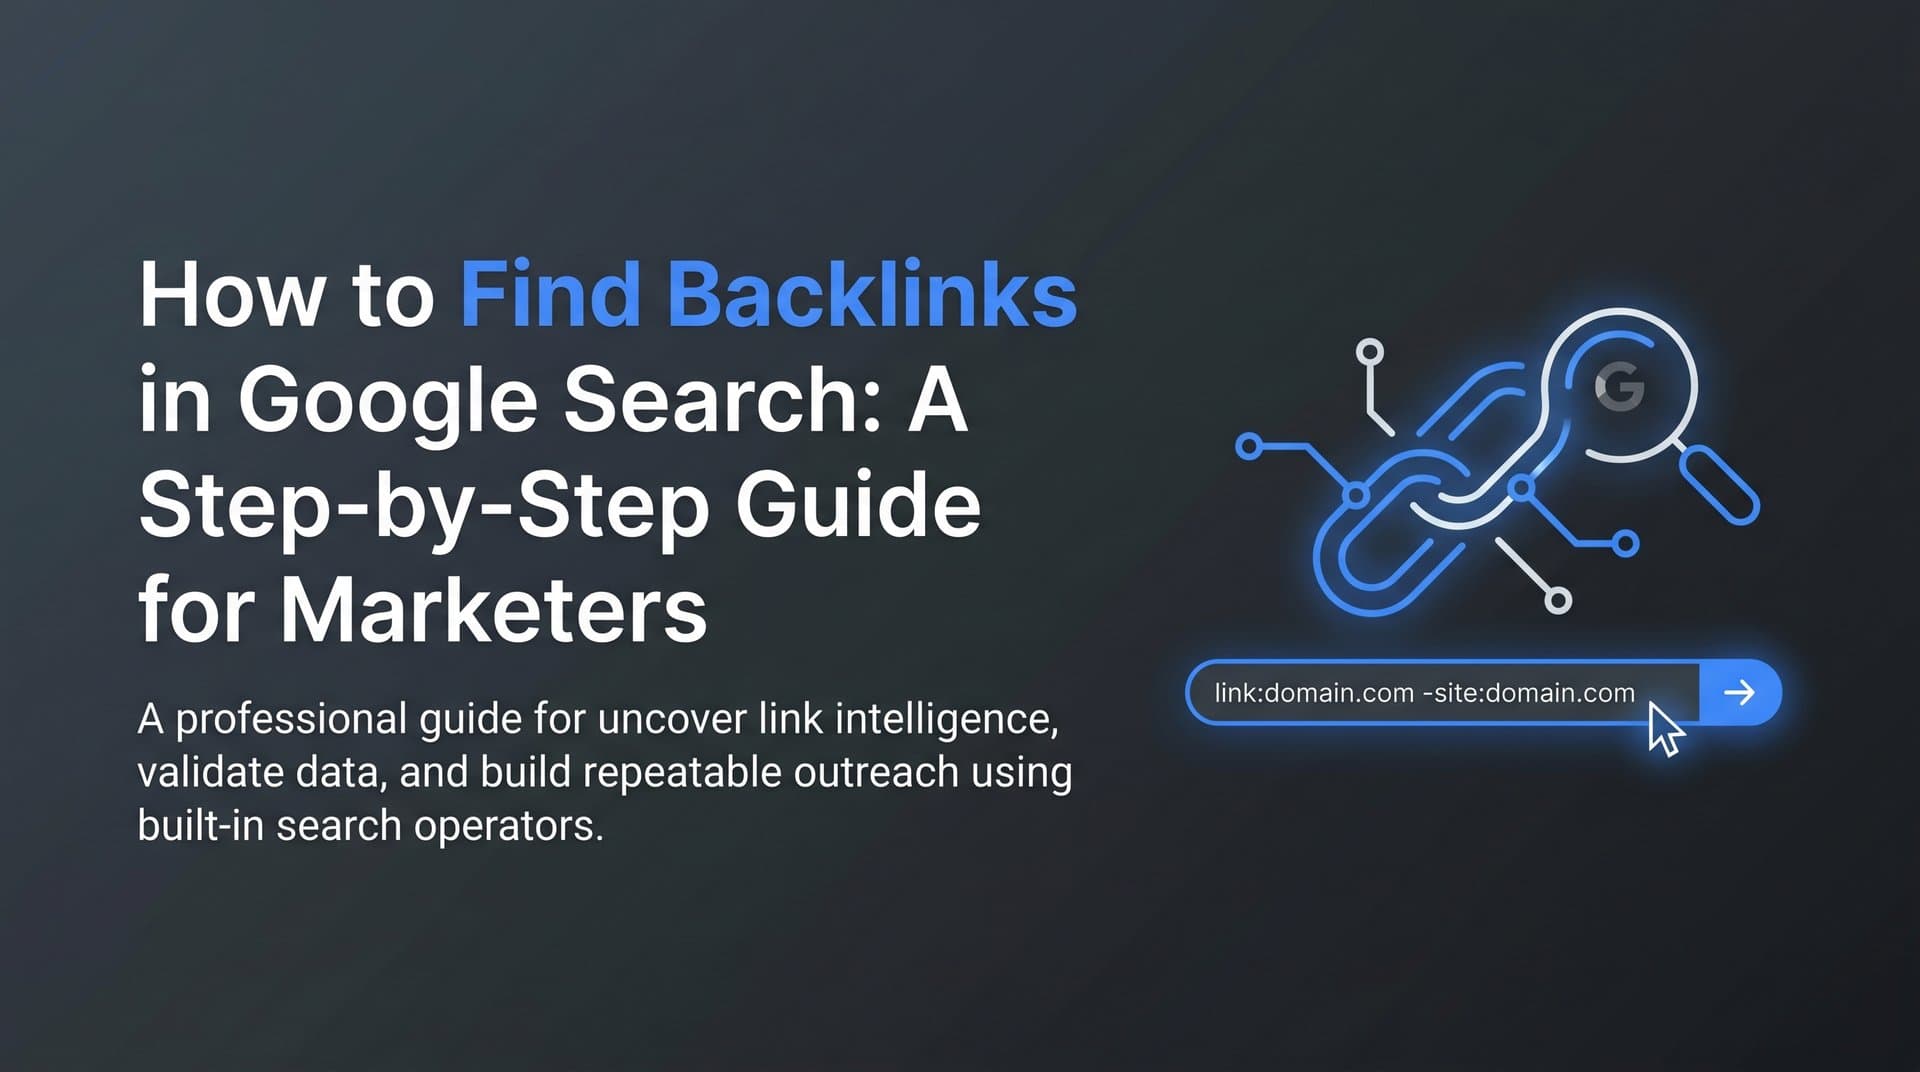
Referral: Visitors who clicked a link on another website. This channel reflects the site's backlink profile and partnership ecosystem.
Social: Visitors arriving from social media platforms. The mix of organic social versus paid social matters here.
Paid: Visitors from paid advertising campaigns, including search ads, display, and paid social. High paid traffic dependency can be a risk signal if organic channels are weak.
Reading Channel Data in Practice: In GA4, the Traffic Acquisition report gives you this breakdown for your own site. In SimilarWeb, the "Traffic Sources" section shows channel distribution for any domain. When analyzing a competitor, pay close attention to the referral channel. If a site receives a disproportionate share of referral traffic, that suggests a strong backlink strategy or active partnership network, and those referring domains are worth investigating as potential link-building targets for your own site.
Turning Channel Data into Strategy: If your organic share is low relative to competitors, that's a signal to invest more in SEO and content. Learning how to increase website traffic organically can help you shift that balance. If a competitor's social traffic is surging, investigate what content formats or platforms they're using. Channel analysis doesn't just tell you what's happening; it tells you where to focus next.
Step 4: Analyze Organic Search Traffic and Keyword Drivers
Organic search deserves its own dedicated analysis step because it's the channel most directly influenced by content strategy and SEO investment. Understanding which keywords drive traffic, for your site and competitors', is where competitive intelligence gets genuinely powerful.
For Your Own Site, Start with Search Console: In the Performance report, filter by "Queries" to see every keyword your site ranks for, along with impressions, clicks, CTR, and average position. Sort by clicks to identify your top traffic-driving keywords. Then sort by impressions with low clicks to find keywords where you have visibility but aren't converting searchers effectively, often because you're ranking on page two or because your title tag isn't compelling enough. These are your quick-win optimization opportunities.
For Competitors, Use SEMrush or Ahrefs: In SEMrush's Domain Overview or Organic Research section, enter a competitor's domain to see their top organic keywords by estimated traffic contribution. Ahrefs' Site Explorer shows the same data under "Organic Keywords." Look for patterns: which topics or content categories drive the most traffic for them? Are there keywords where they rank in positions 4-10 that you could target to displace them? If your pages aren't showing up in results at all, it's worth investigating whether your website isn't showing up on Google due to indexing or technical issues.
Finding Content Gaps: Both SEMrush and Ahrefs have dedicated "Content Gap" or "Keyword Gap" tools that show you keywords a competitor ranks for that your site doesn't. This is one of the most efficient ways to identify content creation priorities. Instead of brainstorming topics from scratch, you're identifying proven demand that competitors are already capturing and building content to compete directly.
Connecting Keywords to Content Priorities: Not all keyword traffic is equal. A keyword driving 5,000 monthly visits with high commercial intent is more valuable than one driving 10,000 visits from purely informational searchers who'll never convert. When you analyze organic keyword drivers, layer in intent signals. Keywords with "best," "review," "vs," or "buy" signals indicate commercial intent. Informational keywords build awareness and topical authority. Understanding how blogging grows organic traffic can help you build a content engine that captures both informational and commercial queries over time.
Step 5: Track AI Visibility as an Emerging Traffic Signal
Here's what traditional traffic tools miss entirely: a growing share of brand discovery now happens inside AI-powered platforms. When someone asks ChatGPT for the best project management tools, or asks Perplexity to recommend SEO software, or asks Claude to compare marketing platforms, the brands mentioned in those responses receive real-world attention and traffic. And none of that shows up in your GA4 dashboard or any third-party traffic estimator.
How AI Models Surface Brands: AI assistants like ChatGPT, Claude, Perplexity, and Google's AI Overviews generate responses to user queries by drawing on their training data and, increasingly, real-time web retrieval. The brands and resources they mention in those responses aren't randomly selected. They reflect which brands have the strongest content footprint, the most authoritative coverage across the web, and the clearest positioning for specific use cases. Understanding how ChatGPT ranks websites gives you insight into what signals these models prioritize when deciding which brands to recommend.
What AI Visibility Tracking Looks Like: Monitoring your AI visibility means systematically tracking which prompts trigger mentions of your brand across AI platforms, what sentiment those mentions carry (are you described positively, neutrally, or not at all?), and how your visibility compares to competitors. This is a fundamentally different discipline from traditional SEO, but it follows similar logic: understand where you appear, where you don't, and why.
How Sight AI Helps: Sight AI's AI Visibility Score gives marketers and founders a structured way to track brand mentions across major AI platforms including ChatGPT, Claude, and Perplexity. Instead of manually querying AI tools and logging responses in a spreadsheet, Sight AI monitors prompt coverage, surfaces sentiment analysis, and shows you exactly where your brand appears or doesn't appear in AI-generated responses. It's the equivalent of Search Console for AI search, giving you data you can actually act on.
Connecting AI Visibility to Content Strategy: The emerging discipline of GEO (Generative Engine Optimization) focuses on creating content that AI models are more likely to reference and cite. This means writing with clarity and authority, building topical depth across your content library, earning coverage from authoritative sources, and ensuring your content is indexed and discoverable. Learning how to drive organic traffic from AI search is becoming essential for any brand that wants to stay visible as discovery shifts toward conversational AI platforms.
Ignoring AI visibility in 2026 is like ignoring mobile traffic in 2015. The shift is already underway, and the marketers who build tracking and optimization habits now will have a meaningful head start.
Step 6: Build a Repeatable Traffic Monitoring Dashboard
Running a one-time traffic analysis is useful. Building a system that surfaces insights automatically every week or month is transformative. The goal of this final step is to consolidate everything you've learned into a sustainable monitoring workflow.
Combining Your Data Sources: Your traffic monitoring setup should pull from three layers. First, first-party data from GA4 and Search Console for your own site's performance. Second, third-party estimates from SimilarWeb or SEMrush for competitive benchmarking. Third, AI visibility data from a tool like Sight AI to track your brand's footprint across AI platforms. These three layers together give you a view of traffic that no single tool can provide on its own.
Setting Your Review Cadence: For most marketers and founders, a weekly review of key metrics combined with a more thorough monthly analysis works well. Weekly reviews catch anomalies quickly: a sudden traffic drop might indicate a technical issue, a Google algorithm update, or a tracking problem that needs immediate attention. You can also use tools that monitor website changes to detect shifts in competitor strategy or your own site's technical health. Monthly reviews are better for spotting trends, evaluating content performance, and making strategic decisions about where to invest next.
Key Metrics to Track Consistently: Keep your dashboard focused on the metrics that actually drive decisions.
Total Sessions and Users: Your baseline volume metrics from GA4, tracked week-over-week and month-over-month.
Organic Clicks and Impressions: From Search Console, showing your organic search health and trajectory.
Top Landing Pages: Which pages are driving the most entrances, and how is that list changing over time?
Channel Mix: Is your organic share growing or shrinking relative to paid and direct? Shifts here signal strategic changes worth investigating.
AI Mention Frequency and Sentiment: How often does your brand appear in AI responses, and is that coverage positive and accurate?
Turning Insights into Action: A dashboard is only valuable if it drives decisions. Build simple rules for yourself: if a top landing page drops more than a certain threshold in organic clicks week-over-week, it triggers an audit. If a competitor's estimated traffic surges significantly, investigate what content they've published. If your AI visibility score drops on a key topic, prioritize creating authoritative content on that subject and ensure it's indexed quickly. Sight AI's IndexNow integration can help speed up website indexing by notifying search engines of new content immediately, reducing the lag between publishing and indexing.
The marketers who build this kind of systematic monitoring stop reacting to traffic changes after they've already happened and start anticipating them.
Your Traffic Analysis Checklist
Seeing how much traffic a site gets isn't a one-tool task. It's a multi-layered process that requires combining first-party precision, third-party estimation, channel-level analysis, and emerging AI visibility signals into a coherent picture.
Keep this checklist handy as your repeatable workflow:
1. Check GA4 and Search Console for your own site's baseline traffic, channel mix, and top organic keywords.
2. Cross-reference at least two third-party tools (SimilarWeb, SEMrush, or Ahrefs) for competitor traffic estimates, and look for directional trends rather than exact numbers.
3. Break down traffic by channel for both your site and competitors to identify where the real strategic opportunities lie.
4. Drill into organic keyword data to find content gaps, quick-win optimization opportunities, and topics worth targeting.
5. Monitor your AI visibility across major AI platforms to understand how your brand is being surfaced (or missed) in AI-generated responses.
6. Review your traffic dashboard on a consistent cadence, weekly for anomalies and monthly for strategic decisions, and act on what you find.
The marketers and founders who combine traditional traffic analysis with AI visibility tracking will have a significant edge. They'll see the full picture of how audiences discover brands in 2026 and beyond, not just through search engines, but through the AI assistants that are increasingly mediating how people find information and make decisions.
Stop guessing how AI models like ChatGPT and Claude talk about your brand. Start tracking your AI visibility today and see exactly where your brand appears across top AI platforms, so you can close the gaps, optimize your content, and capture the traffic that traditional analytics tools aren't even measuring yet.