Understanding how much traffic a domain receives is one of the most fundamental skills in digital marketing. Whether you're evaluating a potential partnership, benchmarking your site against competitors, or diagnosing a sudden drop in organic visits, knowing how to check domain traffic accurately gives you the data foundation for every strategic decision that follows.
Yet many marketers rely on a single tool or metric, which often paints an incomplete picture. Traffic comes from multiple channels: organic search, paid ads, referrals, direct visits, social, and increasingly, AI-driven discovery. Each channel requires a slightly different measurement approach, and ignoring any one of them means you're working with partial information.
Here's the thing: checking domain traffic isn't just about pulling up a number. It's about understanding where visitors come from, which pages attract them, how your domain compares to competitors, and whether your brand is being surfaced in AI-powered search environments that don't even send traditional clicks to your site.
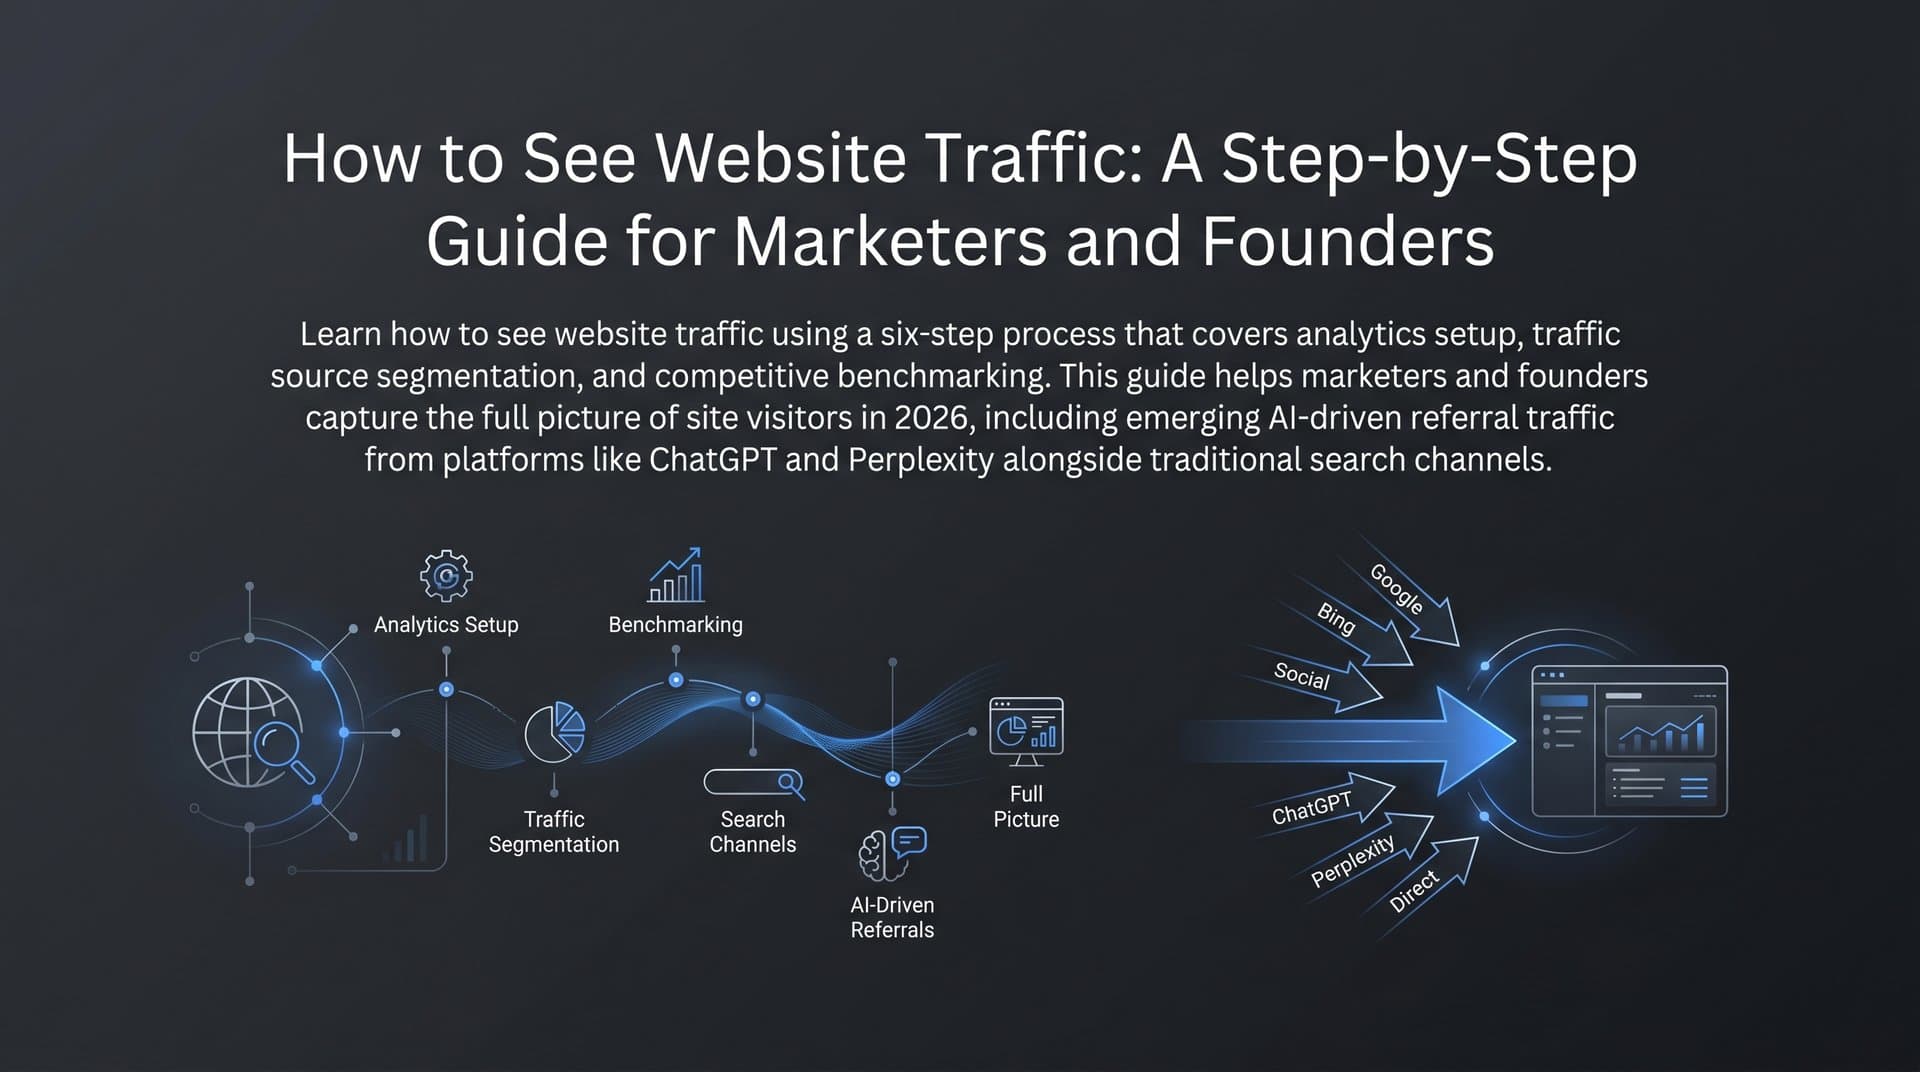
This guide walks you through a clear, repeatable six-step process for checking domain traffic. You'll start with first-party analytics for your own domain, learn to read reports like a seasoned SEO, use third-party tools to estimate competitor traffic, identify content opportunities, layer in AI search visibility, and finally build a monitoring dashboard that keeps you informed week over week.
By the end, you'll have a reliable workflow you can apply to any domain, whether it's your own property or a site you're researching from the outside. Let's get into it.
Step 1: Set Up First-Party Analytics for Your Own Domain
Before you look at any competitor data or third-party estimates, you need a solid foundation of first-party data for your own domain. This is the gold standard: actual visit data, not projections or models. Two tools are non-negotiable here.
Google Analytics 4 (GA4): GA4 is the current version of Google's analytics platform, having replaced Universal Analytics in July 2023. It uses an event-based data model rather than the session-based model of its predecessor, which changes how traffic is reported and segmented. Install the GA4 tracking code (or use Google Tag Manager) on every page of your site, then verify it's firing correctly using the GA4 DebugView or the Tag Assistant browser extension.
Google Search Console: This free tool connects directly to Google's index and provides verified search performance data, including impressions, clicks, click-through rate (CTR), and average position. It's the only source that shows you exactly how Google sees your site's search presence. Add your domain as a property, verify ownership via DNS record or HTML tag, and submit your sitemap.
Bing Webmaster Tools: Often overlooked, Bing Webmaster Tools provides similar performance data for Bing and Yahoo search. Given that Bing powers search results in several AI platforms including Microsoft Copilot, this data is increasingly relevant. Set it up as a companion to Search Console by using a Bing rank checker to monitor your positions there as well.
Once your tools are live, configure the views you'll actually use. In GA4, bookmark the Traffic Acquisition report under Reports > Acquisition. In Search Console, get familiar with the Performance report and its filters for queries, pages, countries, and devices.
Before you trust your data, run a quick verification checklist. Confirm the tracking code fires on every page, including checkout pages, thank-you pages, and blog posts. Set up an internal traffic filter in GA4 to exclude visits from your own team's IP addresses, which would otherwise inflate your numbers. Check that your domain isn't double-counting traffic due to multiple tracking snippets.
First-party data shows you actual visits. Everything else is an estimate. That distinction matters enormously when you're making strategic decisions, so get this foundation right before moving on.
Step 2: Read Your Traffic Reports Like a Pro
Having analytics installed is one thing. Knowing what to look at and what it means is another. This step is about extracting actionable insight from your reports rather than just glancing at headline numbers.
Start with GA4's Traffic Acquisition report. This breaks down your sessions by channel group: organic search, direct, referral, paid search, social, email, and others. Your goal here is to understand the relative contribution of each channel. If organic search drives a large share of your visits, changes in Google's algorithm will have an outsized impact on your business. If direct traffic is unusually high, it might indicate strong brand recognition or, alternatively, miscategorized traffic from dark social sources like messaging apps. Understanding the nuances of direct traffic vs organic search helps you interpret these numbers correctly.
Next, move to Google Search Console's Performance report. This is where you see the search-specific data GA4 can't provide: how many times your pages appeared in search results (impressions), how many people clicked through (clicks), your CTR, and your average ranking position. Filter by page to identify your top traffic-driving content. Filter by query to see which search terms are sending visitors your way.
Now let's talk about the metrics themselves, because using the wrong one for your goal leads to bad conclusions.
Sessions: A session is a group of interactions a user has with your site within a given timeframe. Use sessions when you want to understand visit volume and user behavior patterns.
Users: This counts unique individuals (based on device/cookie). Use users when you want to understand reach, such as how many distinct people visited your site in a month.
Pageviews (or Views in GA4): This counts every time a page loads. Use this to identify your most-visited content, but be aware that a single user can generate many pageviews in one session.
One of the most valuable habits you can build is comparing date ranges. In GA4, use the date comparison feature to look at this month versus last month, or this quarter versus the same quarter last year. Seasonal businesses will see predictable fluctuations; unexpected drops or spikes outside those patterns deserve investigation.
Spot trends by looking at the traffic trend graph over a 90-day window. A gradual decline in organic sessions often signals a rankings issue. A sudden drop on a specific date might correlate with a Google algorithm update. A spike could mean a piece of content went viral or earned a high-authority backlink. Learning how to measure SEO success through these patterns is what separates data-literate marketers from everyone else.
Step 3: Estimate Traffic for Any Domain Using Third-Party Tools
When you want to check domain traffic for a site you don't own, you need third-party estimation tools. These platforms use a combination of clickstream panel data, keyword databases, web crawls, and machine learning models to estimate how much traffic a domain receives and from which sources.
The most widely used options include:
Semrush: Provides organic traffic estimates, paid traffic estimates, top keywords by traffic contribution, and trend graphs. Strong keyword database, particularly for English-language search.
Ahrefs: Known for its backlink index and organic search data. The Site Explorer tool shows estimated organic traffic, top pages, and keyword rankings. Useful for identifying which content drives the most visits to any domain.
SimilarWeb: Takes a different approach by focusing on total traffic across all channels, including direct, social, and referral. Better for understanding overall audience size and traffic mix rather than keyword-level SEO data.
Ubersuggest: A more affordable option that provides basic traffic estimates, top pages, and keyword data. Useful for quick directional checks without a premium subscription.
Here's how to run a basic competitor traffic check. Enter the domain into your chosen tool's search bar. Review the organic traffic estimate and note the trend direction over the past 12 months. Look at the top pages report to identify which content drives the most visits. Check the top keywords report to see which search queries the domain ranks for and what position they hold. For a broader overview of available platforms, our guide to organic traffic growth tools covers several options worth evaluating.
The critical thing to understand about these tools: their estimates can vary significantly from each other, and from actual traffic, for the same domain. This isn't a flaw in any single tool; it's an inherent limitation of estimation models. A domain with significant direct or branded traffic may appear to have lower organic traffic than it actually does. A niche site with highly specific keywords may be underrepresented in keyword databases.
The right way to use these tools is directionally, not as absolute truth. If Semrush estimates a competitor gets 50,000 monthly organic visits and Ahrefs estimates 38,000, the precise number is uncertain. But both tools agreeing that the trend is upward over the past six months? That's a meaningful signal. Cross-reference at least two tools and look for patterns that hold across both before drawing conclusions.
Step 4: Analyze Competitor Domain Traffic to Find Opportunities
Knowing that a competitor gets more traffic than you is interesting. Knowing exactly which content and keywords are driving that traffic is actionable. This step turns competitor research into a content roadmap.
Start by identifying your top three to five organic competitors. These aren't necessarily your business competitors; they're the domains that rank for the same keywords you're targeting. A quick way to find them: search your primary target keyword in Google and note which domains consistently appear in the top results. You can also use Semrush or Ahrefs to pull a competitor report based on keyword overlap with your domain. Tools that let you check your position in Google search make this comparison process much faster.
Once you have your competitor list, run each domain through your third-party tool of choice and focus on three areas.
Top pages by traffic: Which content is driving the most visits to their site? If a competitor's "beginner's guide to X" consistently ranks in the top five and drives significant estimated traffic, that's a format and topic worth noting.
Keyword gap analysis: Most SEO tools offer a keyword gap or content gap feature that shows you keywords driving traffic to competitors that your domain doesn't rank for. These are your most immediate content opportunities. Prioritize gaps where the keyword has meaningful search volume and your competitors are ranking with content you could realistically match or improve.
Referral and backlink sources: Traffic doesn't only come from search. Look at which external sites link to your competitors and potentially send referral traffic. High-authority sites in your niche that link to competitors but not to you are worth pursuing for backlinks and referral traffic.
Turn these findings into a prioritized content roadmap. Group the keyword gaps by topic cluster, estimate their traffic potential, and assess how competitive they are. Topics where competitors rank with thin or outdated content are your fastest wins, and learning how to optimize content for SEO ensures your new pages outperform what's already ranking. Topics where multiple high-authority domains have comprehensive coverage require more investment but can deliver significant long-term traffic.
The goal is to move from observation to action: every competitor traffic insight should connect to a specific piece of content you'll create or a page you'll optimize.
Step 5: Track AI Search Visibility Alongside Traditional Traffic
Here's where modern traffic analysis gets genuinely interesting, and where many marketers are still operating with a blind spot.
AI-powered search tools like ChatGPT, Claude, Perplexity, and Gemini are changing how people find information. Instead of clicking through to a website, users increasingly get direct answers from AI models that synthesize information from across the web. These models may reference your brand, cite your domain, or describe your product without ever sending a click to your site. Understanding the dynamics of AI replacing Google search traffic is critical for any marketer tracking domain performance today.
This creates a visibility layer that traditional analytics simply cannot capture. Your GA4 data won't show you that an AI model mentioned your brand in response to a thousand queries today. Your Search Console data won't reflect impressions generated in an AI chat interface. If you're only measuring traffic through traditional channels, you're missing an increasingly significant part of how your brand is being discovered.
Think of it this way: a user asks Perplexity "what's the best tool for tracking organic traffic?" If Perplexity mentions your brand in its answer, that's a brand impression that influences perception and consideration, even if the user never visits your site in that session. Over time, consistent AI mentions build brand authority that eventually converts into direct traffic, branded searches, and word-of-mouth referrals.
Monitoring AI visibility requires a different approach than traditional analytics. You need to track which prompts and queries cause AI models to mention your domain, how your brand is described (sentiment), and how your visibility compares to competitors across different AI platforms. Our deep dive into organic traffic from AI search explains how to make platforms like ChatGPT and Claude recommend your brand consistently.
This is precisely what Sight AI's AI Visibility Score is built for. It monitors brand mentions across platforms like ChatGPT, Claude, Perplexity, and others, tracking sentiment and prompt coverage so you can see exactly how AI models talk about your brand. Instead of guessing whether your content strategy is influencing AI responses, you get measurable data that sits alongside your traditional organic search metrics.
For any complete picture of domain traffic and brand visibility in 2026, AI visibility tracking is no longer optional. It's the channel that traditional analytics can't see.
Step 6: Build a Recurring Traffic Monitoring Dashboard
Checking domain traffic once is useful. Checking it on a consistent schedule, with a structured dashboard, is what separates reactive marketers from strategic ones.
Your monitoring dashboard should pull together three data layers: first-party analytics from GA4 and Search Console, third-party competitive estimates from Semrush or Ahrefs, and AI visibility data from a platform like Sight AI. Each layer answers a different question: what's happening on your site, how you compare to competitors, and how AI models are representing your brand. A well-built SEO performance dashboard ties all of these data sources into a single view.
For weekly monitoring, focus on these core metrics:
Organic sessions: Your week-over-week organic traffic from GA4. Flag any change greater than 10-15% for investigation.
Top landing pages: Which pages are driving the most visits this week? Any new entries or significant drops?
Keyword rankings: Track your target keywords in Search Console or your SEO tool. Position changes often precede traffic changes by days or weeks.
AI mention frequency: How often is your brand appearing in AI model responses for your target prompts? Is sentiment positive, neutral, or negative?
Set up alerts so you don't have to check manually every day. GA4 allows you to configure email alerts for significant traffic changes. Most SEO tools offer ranking change notifications. Proactive alerts mean you can respond to a traffic drop within hours rather than discovering it weeks later during a monthly review.
Use your traffic insights to inform your content calendar. If a particular topic cluster is consistently driving organic sessions and AI mentions, create more content in that area. If a page that used to drive significant traffic has declined, investigate whether it needs an update or a technical fix. Our guide on diagnosing low organic traffic growth walks through the most common causes and solutions.
Finally, automate where you can. If you're using a platform with IndexNow integration, new content you publish gets submitted to search engines automatically, speeding up the time from publication to indexing. Faster indexing means faster traffic. That kind of operational efficiency compounds over time.
Your Traffic Monitoring Checklist and Next Steps
Checking domain traffic is not a one-time task. It's an ongoing discipline that sharpens your strategic thinking every week. Here's a quick-reference checklist to bookmark:
1. Install and verify GA4 and Google Search Console for your domain.
2. Set up Bing Webmaster Tools and configure internal traffic filters.
3. Review your Traffic Acquisition report weekly to monitor channel performance.
4. Use Search Console's Performance report to track impressions, clicks, CTR, and position.
5. Run competitor domains through Semrush, Ahrefs, or SimilarWeb to estimate their traffic and identify top pages.
6. Conduct a keyword gap analysis to find content opportunities your competitors are capturing.
7. Monitor AI search visibility to track brand mentions across ChatGPT, Claude, Perplexity, and Gemini.
8. Build a recurring dashboard combining first-party data, competitive estimates, and AI visibility metrics.
9. Set up alerts for significant traffic changes so you can respond quickly.
10. Use traffic insights to drive your content calendar and publishing cadence.
The marketers who win in organic search are the ones who treat traffic data as a living signal, not a static report. And as AI-powered search continues to reshape how people discover information, layering AI visibility tracking on top of traditional analytics isn't just smart: it's essential.
Stop guessing how AI models like ChatGPT and Claude talk about your brand. Get visibility into every mention, track content opportunities, and automate your path to organic traffic growth. Start tracking your AI visibility today and see exactly where your brand appears across top AI platforms.