As AI-generated answers become a primary way people discover products, services, and brands, the question of how large language models reference you has become a genuine strategic concern. Whether you're a marketer tracking brand mentions across ChatGPT and Claude, a founder trying to understand your AI search presence, or an engineering team building LLM-powered applications that need performance and cost visibility, the monitoring platform you choose shapes what you can actually act on.
This review covers platforms across two distinct but related categories: AI visibility monitoring (how LLMs talk about your brand in their outputs) and LLM observability (performance, latency, cost, and quality tracking for teams building with LLMs). Understanding ai brand visibility tracking tools and how ai models mention brands has become just as important as traditional SEO for many growth-focused teams.
Selection criteria for this review: monitoring depth, quality of actionable insights, ease of integration, pricing transparency, and real-world utility for marketers, founders, and technical teams. Here are the top LLM monitoring platforms worth your attention in 2026.
1. Sight AI
Best for: Marketers, founders, and agencies tracking brand presence across AI-generated answers
Sight AI is an AI visibility platform that monitors how your brand appears across ChatGPT, Claude, Perplexity, and other leading AI models, with built-in content generation and indexing tools to actively improve your presence in AI-generated answers.
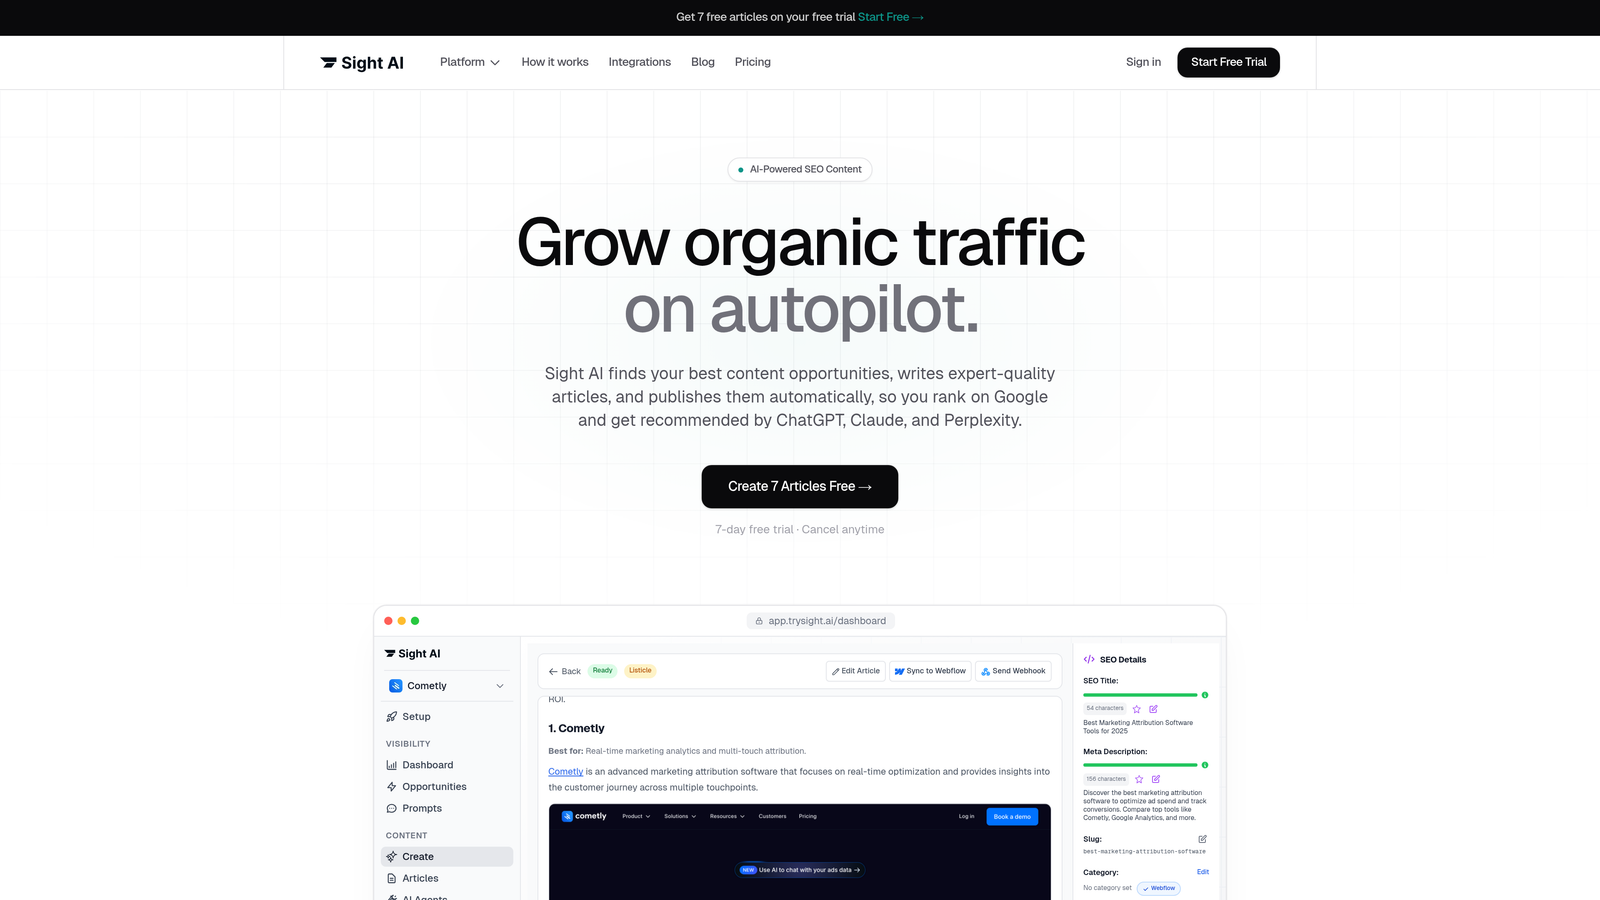
Where This Tool Shines
Sight AI occupies a unique position in the monitoring landscape because it connects brand visibility tracking directly to content action. Most observability tools tell you what's happening technically. Sight AI tells you what AI models are saying about your brand, which competitor names appear alongside yours, and what content you need to publish to shift those outcomes.
The prompt-level tracking is particularly valuable. Rather than giving you vague brand mention counts, Sight AI shows you which specific queries trigger mentions of your brand versus a competitor, so you can prioritize content creation around the gaps that matter most for AI search visibility.
Key Features
AI Visibility Score: Tracks brand mention frequency and sentiment across 6+ AI platforms, giving you a unified score to benchmark and improve over time.
Prompt-Level Tracking: Shows exactly which user queries trigger your brand to appear in AI-generated responses, revealing high-value content opportunities.
13+ AI Content Agents: Specialized agents generate SEO and GEO-optimized articles, listicles, and guides designed to improve your presence in AI-generated answers.
IndexNow Integration: Automatically submits new content to search engines and AI crawlers for faster discovery, shortening the time between publishing and getting indexed.
Competitive Monitoring: Tracks how rival brands appear in AI responses so you can benchmark your visibility against competitors in real time.
Best For
Sight AI is built for marketers, growth-focused founders, and agencies who treat AI search presence as a strategic channel. If your primary concern is understanding and improving how AI models represent your brand rather than debugging LLM application code, this is the platform designed specifically for that job.
Pricing
A free tier is available. Visit trysight.ai for current plan details and to see what's included at each tier.
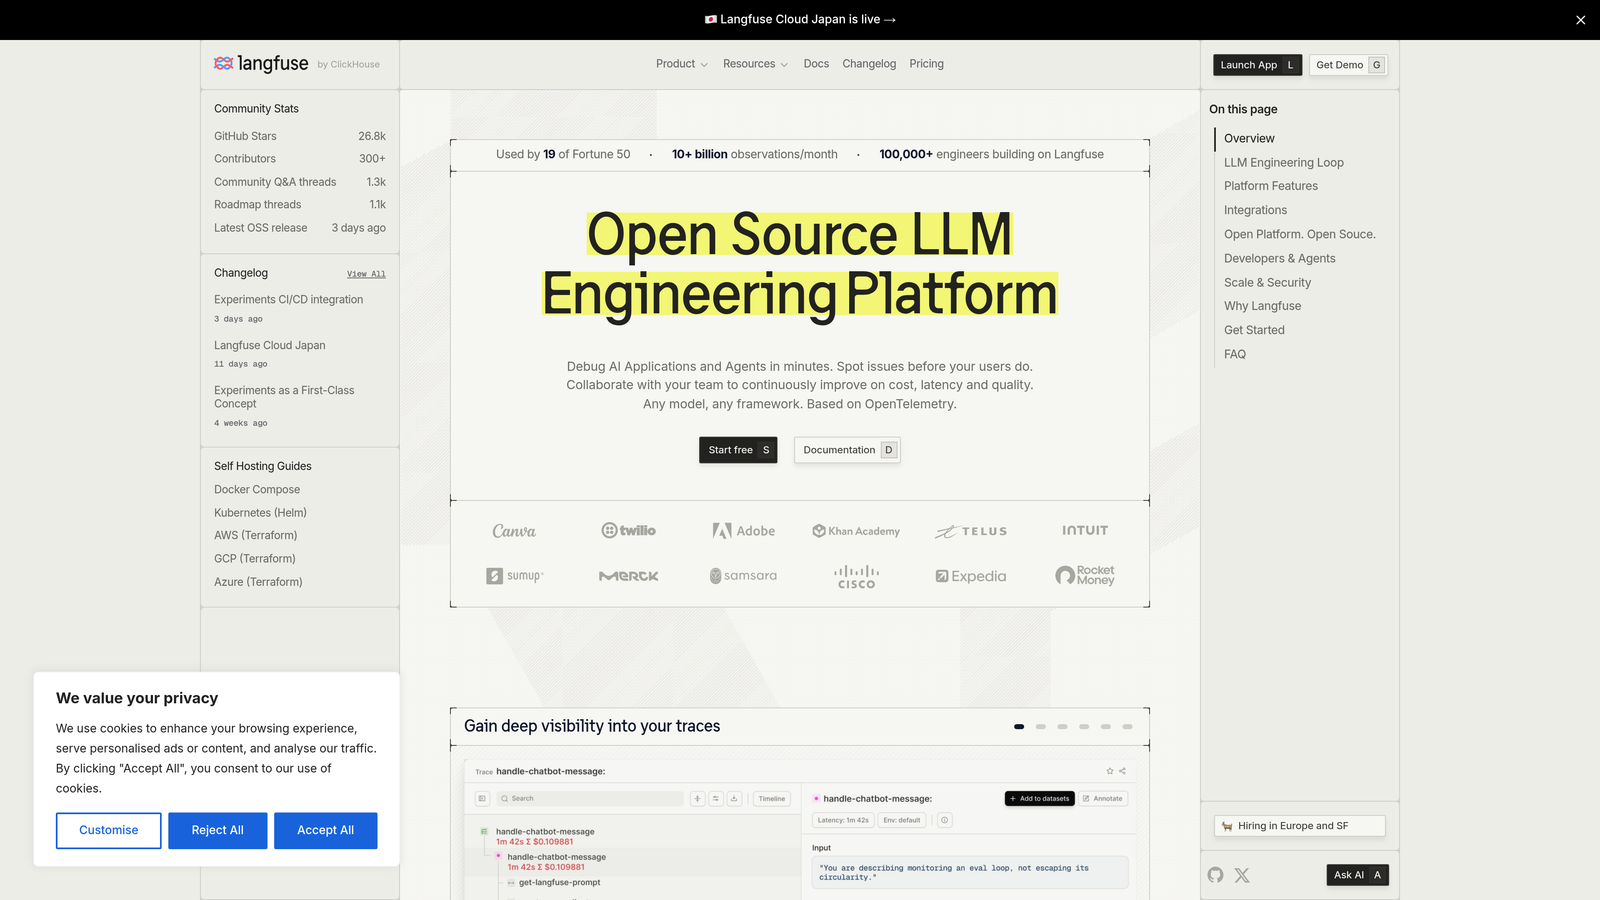
2. Langfuse
Best for: Engineering teams wanting open-source LLM tracing with self-hosting flexibility
Langfuse is an open-source LLM observability platform offering detailed tracing, prompt management, and evaluation for teams building LLM-powered applications.
Where This Tool Shines
Langfuse has built a strong following in the developer community largely because of its open-source foundation. Teams that need to keep sensitive data on their own infrastructure can self-host the entire platform, which is a meaningful differentiator for regulated industries or privacy-conscious organizations.
The trace and span visualization is genuinely detailed. When debugging a multi-step LLM chain, being able to see exactly where latency or quality issues occur at each step saves significant debugging time.
Key Features
Open-Source with Self-Hosting: Full codebase available on GitHub; deploy on your own infrastructure for complete data control.
Trace and Span Visualization: Detailed breakdown of LLM chain execution, showing inputs, outputs, latency, and cost at every step.
Prompt Versioning: Manage and version prompts centrally, with the ability to track how changes affect downstream quality metrics.
Built-In Evaluation Framework: Define custom scoring functions and run evaluations against logged traces to monitor quality over time.
Broad Integrations: Native support for OpenAI, LangChain, LlamaIndex, and other popular LLM frameworks.
Best For
Engineering teams and startups building LLM applications who want strong observability without vendor lock-in. Particularly well-suited for teams with the infrastructure capability to self-host and a need for granular debugging tools.
Pricing
Free open-source tier for self-hosting. Cloud-hosted plans include a generous free tier, with paid plans scaling to higher usage volumes.
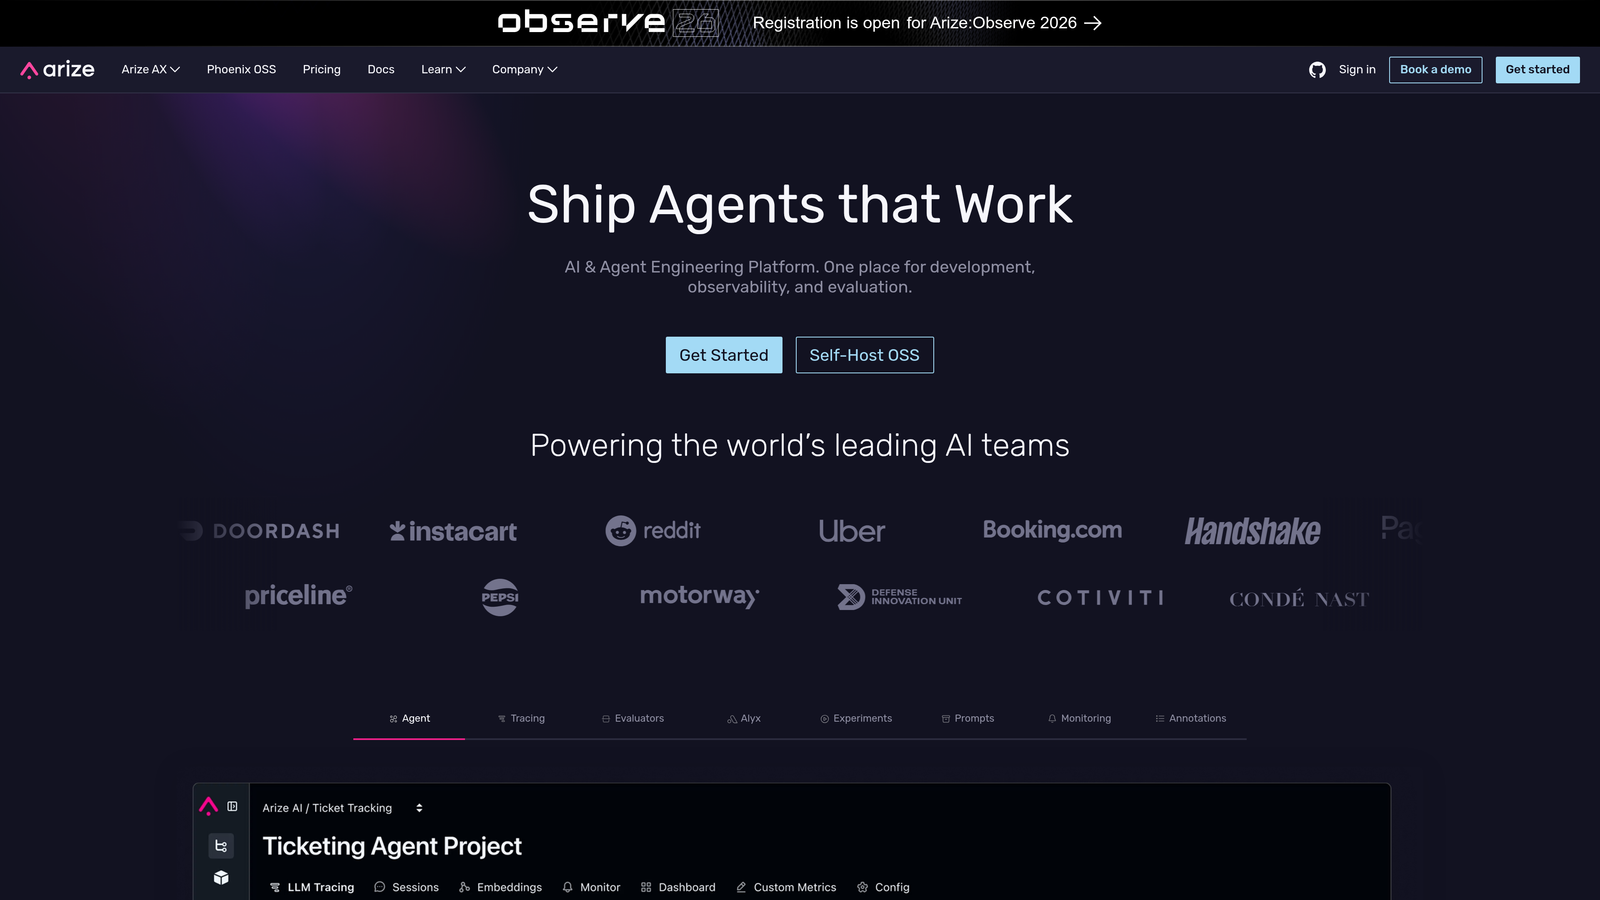
3. Arize AI
Best for: Enterprise teams needing deep ML and LLM observability with embedding analysis
Arize AI is an enterprise ML and LLM observability platform with Phoenix open-source tracing, embedding drift detection, and deep evaluation capabilities for production AI systems.
Where This Tool Shines
Arize has roots in traditional ML monitoring, and that depth shows in its LLM capabilities. Embedding drift detection is a standout feature: it helps teams identify when the distribution of inputs to their LLM applications is shifting in ways that could degrade output quality before users notice the problem.
The Phoenix open-source library gives developers a free entry point for LLM tracing and evaluation, while the Arize cloud platform adds enterprise-grade dashboards, alerting, and team collaboration features on top.
Key Features
Phoenix Open-Source Library: Free LLM tracing and evaluation tool with active community support, usable independently of the Arize cloud platform.
Embedding Drift Detection: Monitors changes in embedding space to catch distribution shifts in LLM inputs before they cause quality regressions.
Automated Hallucination Evaluation: Built-in evaluators score responses for hallucination and relevance without requiring manual review of every output.
RAG Pipeline Monitoring: Specific tooling for retrieval-augmented generation workflows, tracking retrieval quality alongside generation quality.
Enterprise Dashboards and Alerting: Configurable alerts on quality, latency, and cost metrics with team-wide visibility.
Best For
Enterprise ML and data science teams running production LLM applications who need sophisticated evaluation capabilities and are comfortable with a platform that has a steeper learning curve than lighter-weight alternatives.
Pricing
Phoenix is free and open-source. Arize cloud includes a free community tier; enterprise pricing is available on request.
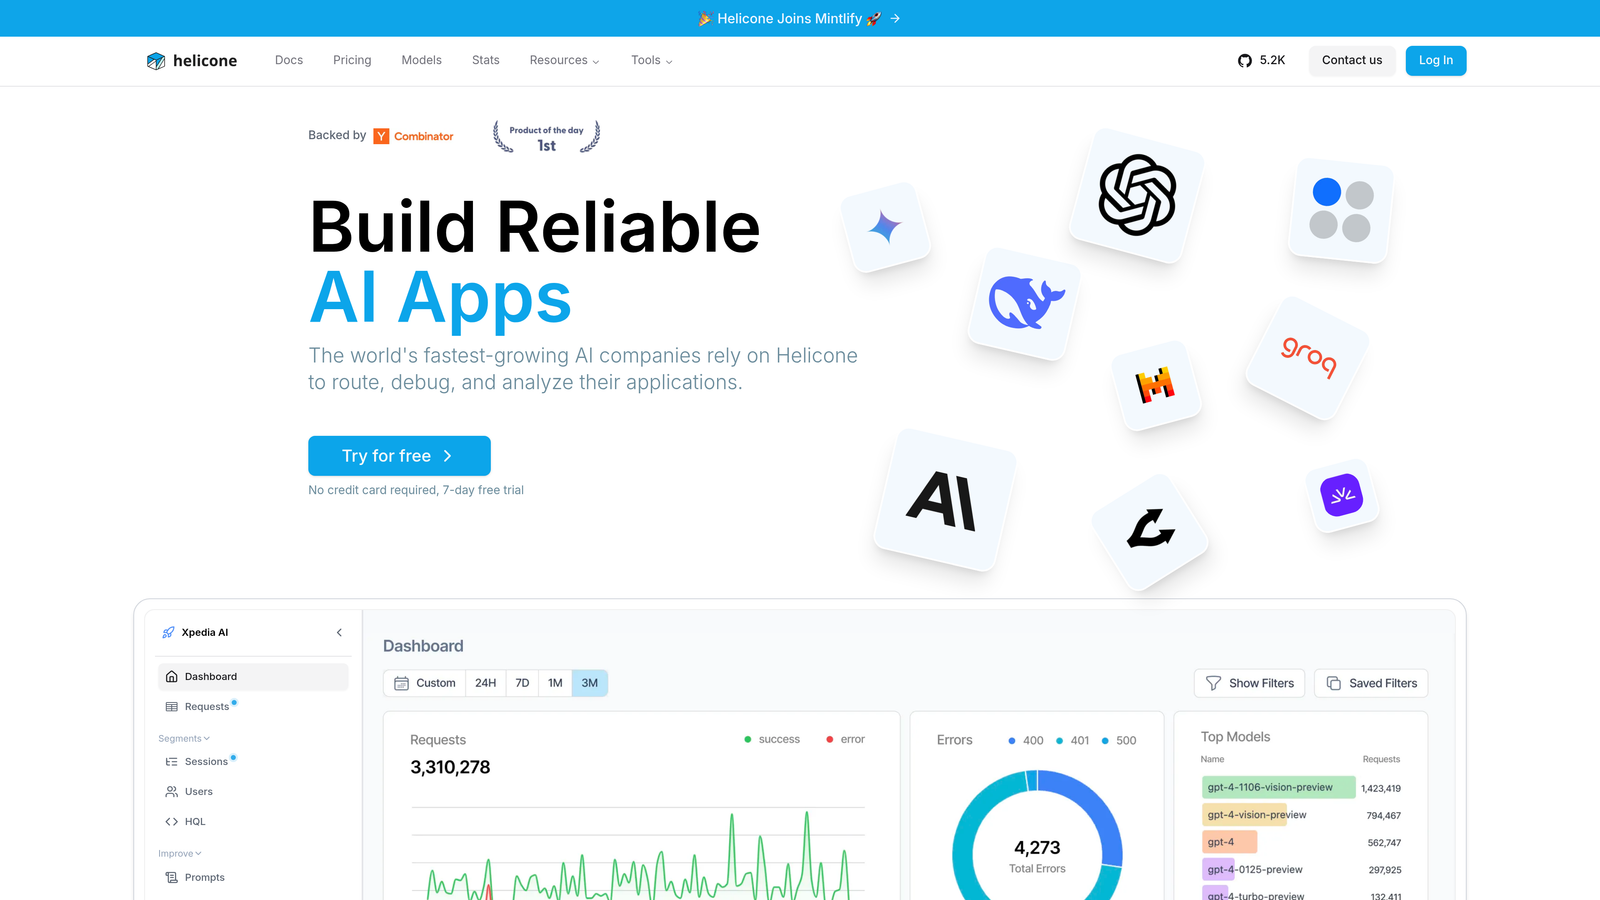
4. Helicone
Best for: Teams wanting instant LLM monitoring with minimal setup effort
Helicone is a lightweight LLM monitoring platform that uses a proxy-based approach for instant request logging, cost tracking, and latency analysis with minimal setup required.
Where This Tool Shines
Helicone's proxy-based architecture is its biggest selling point. Instead of adding an SDK and instrumenting your code, you change one URL in your API calls and Helicone captures everything automatically. For teams that want observability without a significant engineering investment, this approach is genuinely fast to implement.
The cost and latency dashboards are clean and immediately actionable. Seeing per-user, per-model, and per-endpoint cost breakdowns in real time helps teams catch runaway usage before it becomes a billing surprise.
Key Features
One-Line Proxy Integration: Route API calls through Helicone's proxy with a single URL change, no SDK modifications required.
Real-Time Cost and Latency Dashboards: Live visibility into token usage, API costs, and response latency across all LLM calls.
Request and Response Logging: Full searchable log of every LLM interaction with filtering by user, model, time range, and custom properties.
User-Level Analytics: Segment usage and cost data by individual users or user groups for more granular analysis.
Multi-Provider Support: Works with OpenAI, Anthropic, and other major LLM providers through the same proxy interface.
Best For
Startups and product teams that need LLM cost and performance visibility quickly, without dedicating engineering resources to a complex observability setup. Also a good fit for teams already using OpenAI or Anthropic who want usage analytics without changing their existing code significantly.
Pricing
Free tier supports up to 100,000 requests per month. Paid plans unlock higher request volumes and advanced features.
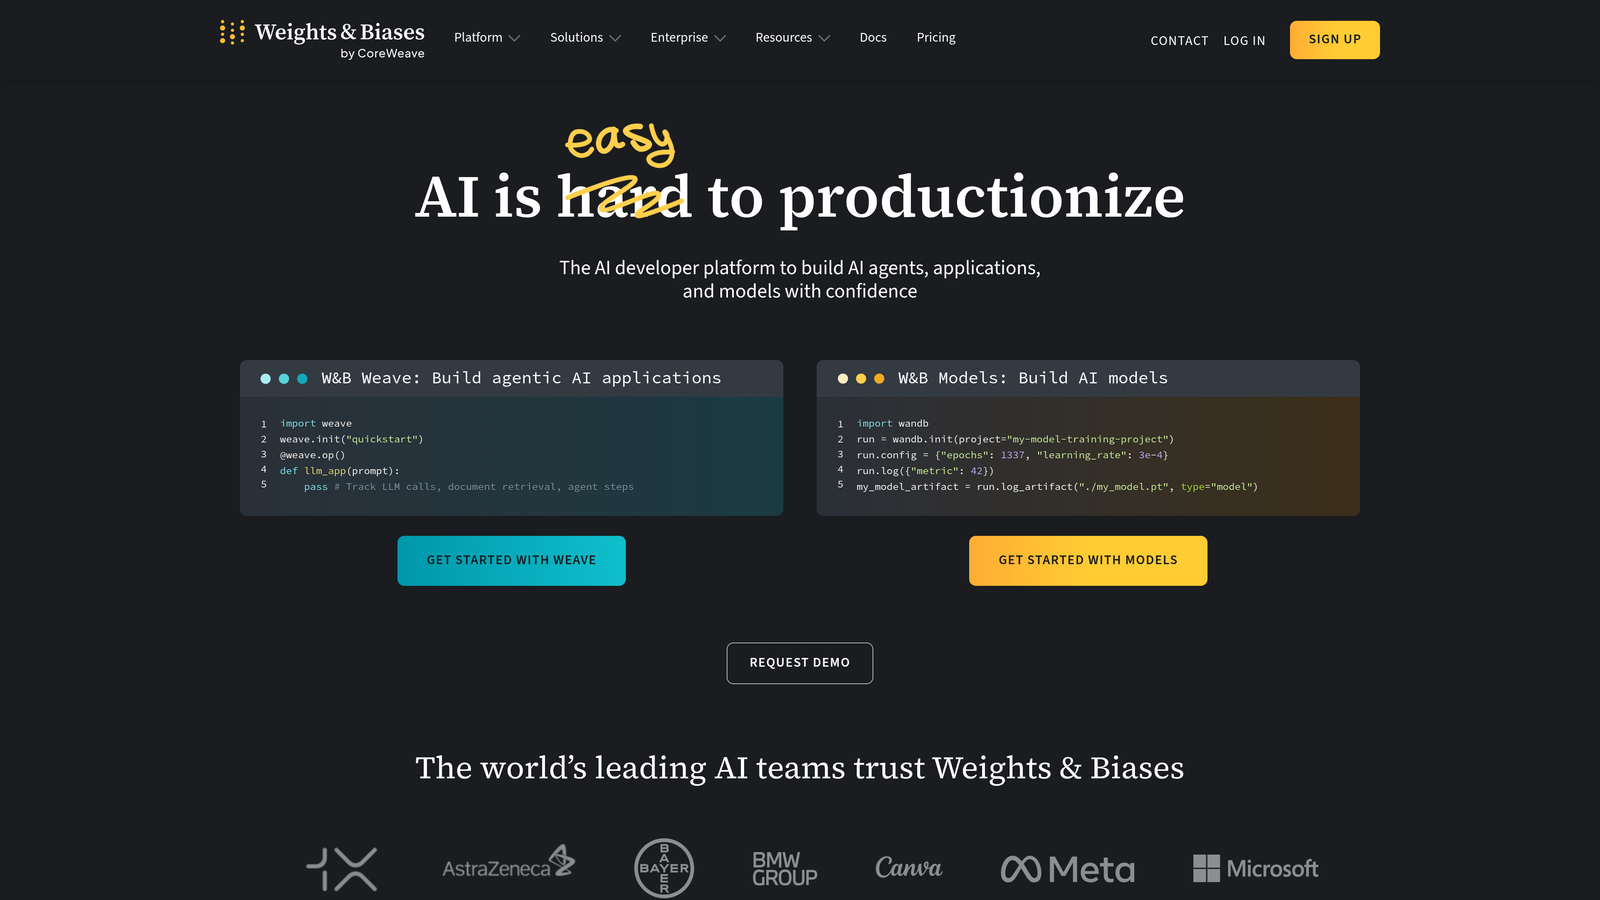
5. Weights & Biases (W&B Weave)
Best for: ML teams extending existing W&B workflows into LLM application monitoring
Weights & Biases is an established MLOps platform extended with Weave for LLM-specific application tracing, prompt versioning, and evaluation workflows integrated with W&B's broader experiment tracking ecosystem.
Where This Tool Shines
If your team already uses W&B for ML experiment tracking, Weave slots in naturally without requiring a separate platform. The lineage between prompt experiments, model evaluations, and production traces is genuinely useful for teams that move between research and production contexts frequently.
Collaborative dashboards are well-executed here. Team members can share traces, annotate results, and compare prompt experiments in a shared workspace, which reduces the friction of aligning on quality decisions across engineering and product teams.
Key Features
Weave LLM Tracing Layer: Purpose-built tracing for LLM applications with a clean API that integrates into existing Python workflows.
Prompt Versioning with Lineage: Track prompt changes alongside experiment results, maintaining a full history of what changed and what effect it had.
W&B Ecosystem Integration: Connects directly to W&B experiment tracking, model registry, and artifact management for teams with existing MLOps workflows.
Collaborative Dashboards: Shared workspaces for teams to review traces, compare evaluations, and align on quality benchmarks.
Custom Evaluation Pipelines: Build and run evaluation workflows against logged traces with support for custom scoring functions.
Best For
ML and AI engineering teams already invested in the W&B ecosystem who want to extend their existing tooling to cover LLM application monitoring without adopting a separate platform.
Pricing
Free for individual users. Team and enterprise plans are available with usage-based pricing for higher trace volumes.
6. Datadog LLM Observability
Best for: Enterprise engineering teams with existing Datadog infrastructure monitoring
Datadog LLM Observability integrates LLM monitoring directly into the Datadog platform, providing unified visibility across LLM traces, infrastructure metrics, and application performance in a single pane of glass.
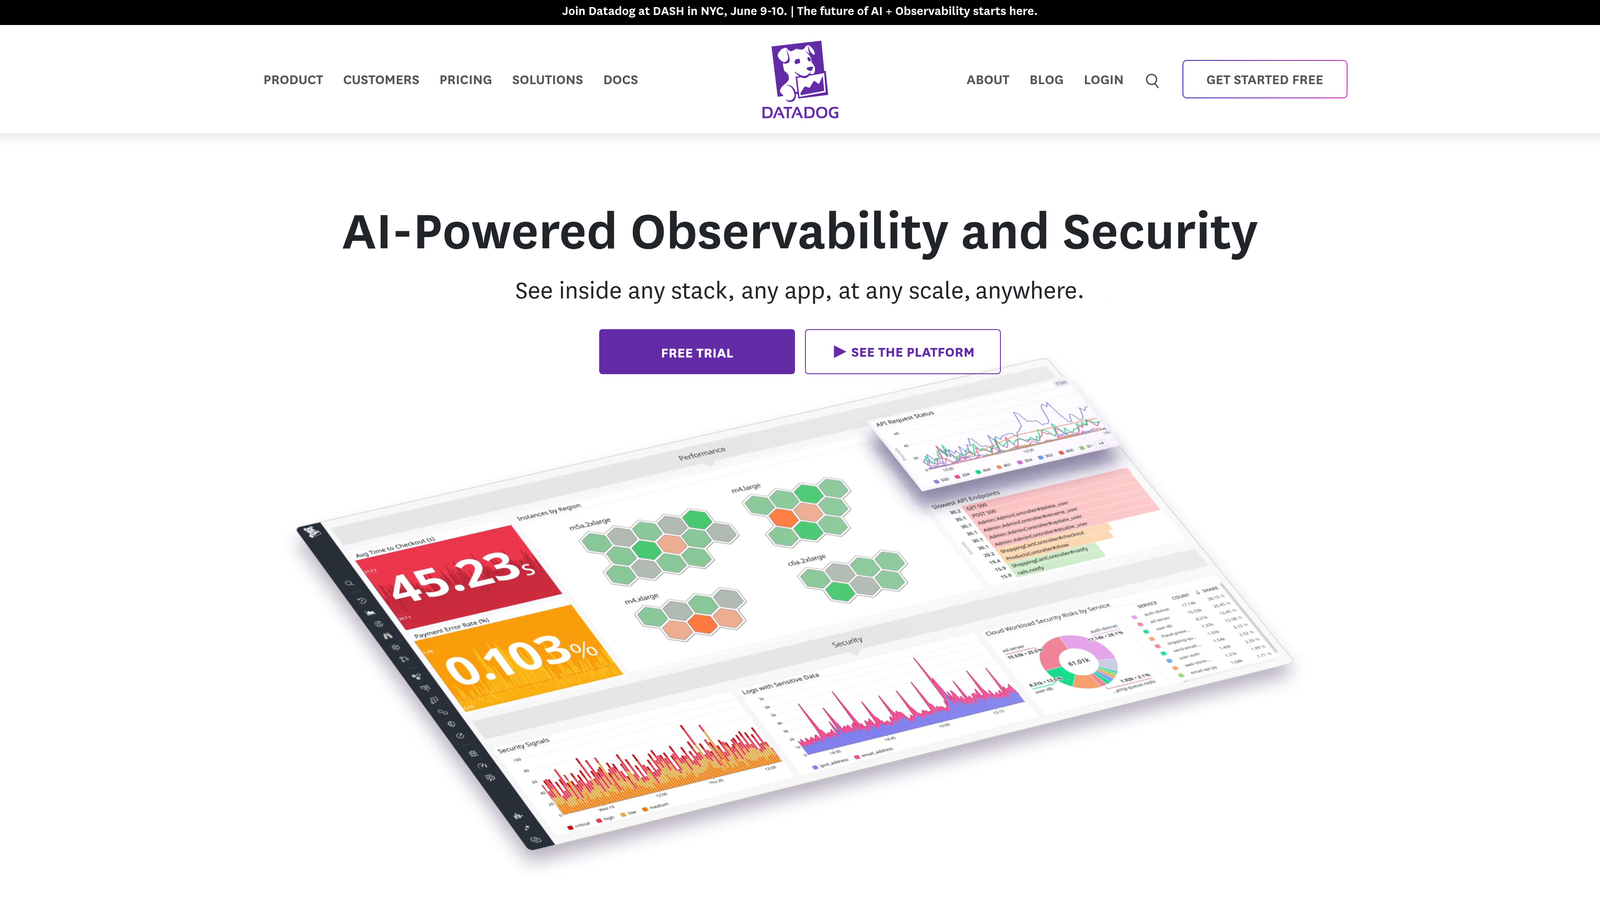
Where This Tool Shines
The core value of Datadog's LLM offering is unification. For teams already using Datadog for APM, infrastructure monitoring, and log management, having LLM traces in the same platform means correlating an LLM latency spike with a database slowdown or a deployment event becomes straightforward. That kind of cross-signal correlation is difficult to replicate when you're jumping between separate tools.
Automated quality evaluation for LLM responses is a newer addition that makes Datadog more competitive with evaluation-focused platforms. It's not as deep as specialized tools like Patronus, but it covers the fundamentals without requiring a separate integration.
Key Features
Unified Observability: LLM traces sit alongside APM, logs, and infrastructure metrics in a single Datadog workspace.
Cost Attribution and Token Tracking: Breaks down token usage and API costs by service, endpoint, or team for accurate cost allocation.
Automated Quality Evaluation: Built-in scoring for LLM response quality, covering relevance and basic safety checks.
Alerting on LLM-Specific Metrics: Configurable alerts on latency, error rates, and cost anomalies with Datadog's existing notification infrastructure.
Multi-Provider Support: Native integrations for OpenAI, Anthropic, Amazon Bedrock, and other major LLM providers.
Best For
Enterprise engineering and platform teams already running Datadog who want to add LLM observability without managing a separate monitoring stack. Less compelling for teams not already in the Datadog ecosystem given the cost structure.
Pricing
LLM Observability is an add-on to existing Datadog plans, priced based on the number of spans ingested. Contact Datadog for specific pricing.
7. LangSmith
Best for: Teams building with LangChain or LangGraph who need deep native debugging
LangSmith is a developer platform by LangChain for debugging, testing, and monitoring LLM applications with particularly deep native support for LangChain chains, agents, and LangGraph workflows.
Where This Tool Shines
If you're building with LangChain or LangGraph, LangSmith's native integration is hard to beat. The run tree visualization for multi-step agent workflows gives you a clear picture of exactly what happened at each decision point, which is invaluable when debugging complex agent behavior that produces unexpected outputs.
The annotation queue feature is underrated. It creates a structured workflow for collecting human feedback on LLM outputs, which feeds directly into evaluation datasets, closing the loop between production monitoring and continuous quality improvement.
Key Features
Native LangChain and LangGraph Tracing: Zero-friction tracing for LangChain-based applications with full visibility into chain and agent execution.
Run Tree Visualization: Visual breakdown of multi-step agent runs, showing inputs, outputs, and intermediate steps at each node.
Dataset Management and Evaluation: Build evaluation datasets from production traces and run automated evaluations to track quality over time.
Prompt Playground: Iterate on prompts rapidly with side-by-side comparison of outputs across prompt variants.
Human Feedback Annotation Queues: Structured workflows for collecting and organizing human feedback on production outputs to improve evaluation datasets.
Best For
Developers and teams using LangChain or LangGraph as their primary LLM application framework. Less differentiated for teams using other frameworks where native integration advantages don't apply.
Pricing
Free developer tier available. Plus and Enterprise tiers unlock higher trace volumes and team collaboration features.
8. Patronus AI
Best for: Enterprise teams with strict compliance and hallucination detection requirements
Patronus AI is an LLM evaluation platform focused on automated hallucination detection, safety scoring, and compliance checks for enterprise AI deployments where output quality and policy adherence are non-negotiable.
Where This Tool Shines
Patronus AI is purpose-built for the evaluation side of LLM monitoring, which makes it more specialized than most platforms in this list. Its hallucination detection scoring goes deeper than the basic quality checks you find in general observability tools, making it relevant for industries like financial services, healthcare, and legal where inaccurate AI outputs carry real risk.
The ability to create custom evaluators for domain-specific quality checks is a significant differentiator. Rather than relying on generic quality metrics, teams can define what "good" looks like for their specific use case and monitor against that standard continuously.
Key Features
Automated Hallucination Detection: Scores LLM outputs for factual accuracy and hallucination risk without requiring manual review at scale.
Toxicity and Policy Compliance Evaluation: Checks outputs against safety and policy standards, flagging violations for review.
Custom Evaluator Creation: Build domain-specific evaluators that reflect your organization's quality standards and compliance requirements.
Continuous Monitoring with Alerting: Monitors production outputs in real time and alerts teams when quality metrics fall below defined thresholds.
Enterprise Compliance Reporting: Generates documentation-ready reports for compliance and audit purposes.
Best For
Enterprise organizations in regulated industries deploying LLMs in customer-facing or high-stakes contexts where hallucination risk, safety, and compliance documentation are primary concerns.
Pricing
Enterprise-oriented with custom pricing. Contact Patronus AI directly for plan details and pricing.
9. Portkey
Best for: Teams wanting unified LLM routing, cost management, and observability in one gateway
Portkey is an AI gateway platform that combines unified LLM routing across providers with built-in observability, caching, fallback logic, and cost management in a single layer that sits between your application and your LLM providers.
Where This Tool Shines
Portkey's gateway architecture means it's solving a different problem than pure observability tools. Beyond just monitoring what's happening, it actively manages LLM traffic: routing requests to the right provider, handling fallbacks when a provider goes down, and caching semantically similar requests to reduce redundant API calls and costs. The observability is built into that routing layer, so you get monitoring as a byproduct of traffic management.
Virtual key management is a practical feature for teams with multiple developers. Instead of sharing raw API keys, each team member or service gets a virtual key with configurable rate limits and permissions, which reduces the security risk of key sprawl across a growing team.
Key Features
Unified Gateway for 200+ LLM Providers: Route requests across providers with automatic fallback logic to maintain reliability when individual providers experience downtime.
Built-In Observability: Request logging, cost tracking, and latency monitoring captured automatically at the gateway layer without additional instrumentation.
Semantic Caching: Caches responses to semantically similar queries, reducing duplicate API calls and lowering costs for applications with repetitive request patterns.
Guardrails and Output Validation: Apply input and output validation rules at the gateway level before responses reach your application.
Virtual Key Management: Issue virtual API keys with granular rate limits and permissions for secure, auditable access control across teams.
Best For
Teams managing multiple LLM providers who want cost management, reliability, and observability handled at the infrastructure level rather than through application-layer instrumentation. Particularly useful for growing teams where API key management and provider redundancy are operational concerns.
Pricing
Free tier available. Paid plans scale based on request volume and feature requirements.
Which Platform Is Right for You
The LLM monitoring landscape in 2026 has matured into two clearly distinct categories, and the right platform depends heavily on which problem you're actually trying to solve.
If your priority is understanding how AI models like ChatGPT, Claude, and Perplexity represent your brand in their answers, Sight AI is the only platform in this list built specifically for that job. It connects brand visibility tracking directly to content creation and indexing, giving you a complete loop from monitoring to action rather than just a dashboard full of data.
For teams building LLM-powered applications who need technical observability, the choice depends on your stack and priorities. Langfuse and Arize Phoenix are strong open-source options for teams that want self-hosting flexibility. Helicone and Portkey win on setup speed, using proxy-based approaches that require minimal code changes. LangSmith is the natural choice if you're deep in the LangChain ecosystem. Datadog LLM Observability makes sense if you're already running Datadog infrastructure monitoring. W&B Weave fits teams already invested in the W&B MLOps stack. And Patronus AI stands out when hallucination detection and compliance documentation are the primary concern.
Many teams end up using two platforms: one for AI brand visibility monitoring and another for technical LLM observability. These are genuinely different problems, and the platforms that solve them well are built differently.
If you're ready to understand exactly how AI models talk about your brand across the platforms your customers are using, start tracking your AI visibility today and see where your brand appears, where it's missing, and what content will move the needle.