SEO ranking data is simply the collection of metrics that tells you how your website is doing in search engine results. It’s the raw feedback that answers questions like, “Where do we show up for this keyword?” or “How many people actually see our link?” This data includes your keyword positions, how often you appear (impressions), and how many people click your links (CTR), giving you a clear report card on your digital visibility.
Your Guide to Understanding SEO Ranking Data

Think of your website as a ship sailing the vast ocean of the internet. Without instruments, you’re just sailing blind. SEO ranking data is your master dashboard, giving you the critical feedback needed to steer your digital strategy toward its true destination—more traffic, more leads, and real growth.
This guide will demystify these numbers and show you how to use them as a compass for your strategy. We're not just going to define metrics; we’ll connect them to tangible business outcomes.
Why This Data Is Essential
Understanding your ranking data is the bedrock of any successful online strategy. It’s direct feedback from the search engines themselves, telling you exactly what’s working and what’s falling flat.
The global SEO market was valued at an eye-watering $82.3 billion in 2023 and is projected to surge to $143.9 billion by 2030. That incredible growth isn't just hype; it's fueled by businesses realizing that SEO is a core driver of sustainable traffic, especially when Google processes over 8.3 billion searches every single day.
By tracking this information, you can:
- Find Hidden Opportunities: See which keywords are already driving traffic and which ones represent untapped goldmines.
- Diagnose Problems Early: Pinpoint pages that are slipping in the rankings or failing to attract clicks before they hurt your bottom line.
- Measure Your Real ROI: Connect your content and outreach efforts directly to improvements in rankings and organic traffic.
- Outmaneuver the Competition: Analyze competitor performance to find strategic gaps you can exploit.
What This Guide Covers
Before we dive deep, here’s a quick overview of the core components we’ll be breaking down.
Quick Overview of Key SEO Ranking Data Components
| Data Component | Primary Goal | Example Metric |
|---|---|---|
| Data Sources | Know where your numbers are coming from. | Google Search Console, SERP Trackers |
| Key Metrics | Understand what each number actually means. | Keyword Position, Click-Through Rate (CTR) |
| Collection & Analysis | Learn how to gather and make sense of the data. | Data Normalization, Trend Analysis |
| Action Frameworks | Turn your insights into concrete actions. | Content Updates, Outreach Campaigns |
This table gives you a roadmap for what’s ahead. We're going to walk through each of these pieces to build a complete picture.
This article will guide you through the core components of SEO ranking data, from collection to action. We’ll explore the key metrics like keyword position and impressions, and even touch on how the rise of AI visibility is changing the game. Our goal is to uncover the strategic power hidden within your data.
"Data is the new oil. It’s valuable, but if unrefined it cannot really be used. It has to be changed into gas, plastic, chemicals, etc. to create a valuable entity that drives profitable activity." - Clive Humby
We'll start by exploring where to find this crucial information, then dive into the specific metrics that matter most. After that, we’ll provide a framework for turning those raw numbers into actionable insights. Understanding this process is the first step, and knowing exactly what is rank tracking is fundamental to your success.
Where to Find Actionable SEO Ranking Data

Good, actionable SEO data isn't hiding in one magic dashboard. It’s pieced together from a few key tools, each giving you a different angle on your performance. Think of it like a detective investigating a case—you need to talk to multiple witnesses to get the full story.
The right tools answer different questions. Some show you how you stack up on Google, others reveal what people do once they land on your site, and a new wave of platforms tracks your footprint in AI conversations. Knowing where to look is the first step to making smarter decisions.
Your Foundational Data Sources
Every solid SEO strategy starts with data straight from the source. These free tools give you the ground truth about your relationship with Google and your visitors, forming the bedrock of your analysis.
Google Search Console (GSC) is your direct line to Google. It’s the most accurate place to see how the search engine views your site, showing you crucial data like clicks, impressions, average position, and the exact search terms people use to find you.
Then there's Google Analytics (GA), which picks up the story after the click. It tracks what users do on your site—how long they stay, which pages they visit, and whether they convert. GSC tells you how you perform in the search results; GA tells you if that traffic is actually valuable.
Here’s the simplest way to think about them:
- GSC answers: "How are we showing up in Google for our target keywords?"
- GA answers: "Are the people finding us through search actually sticking around and doing what we want them to do?"
Gaining a Competitive Edge with SERP Trackers
While Google's tools are non-negotiable for understanding your own site, they leave you blind to the competition. That’s where third-party SERP (Search Engine Results Page) trackers become your secret weapon.
Platforms like Ahrefs, Semrush, and Moz are packed with competitive intelligence. They let you peek over your rivals' shoulders to see their keyword rankings, dissect their backlink profiles, and uncover the content that’s sending them traffic. This outside perspective is critical for finding gaps in your market and spotting threats before they become problems.
For a deeper dive, our guide on the best SERP tracking tools can help you pick the right platform for your goals.
These tools are also fantastic for making your SEO efforts more efficient. They're essential for finding low competition keywords that your bigger competitors might have missed, giving you a chance to secure some quick wins.
The Next Frontier: AI Visibility Platforms
The digital world is no longer just about traditional search engines. AI models like ChatGPT and Gemini are quickly becoming go-to sources for information, and if you're not visible there, you're becoming invisible. This is where AI visibility platforms enter the scene.
AI visibility isn't just a new metric; it's a new dimension of brand presence. It measures your authority and trustworthiness in the systems that are increasingly shaping user perception and knowledge.
Tools like Sight AI were built specifically for this new reality. They monitor how AI models reference your brand, your products, and your industry, giving you a completely new layer of insight.
This helps you answer questions that traditional tools simply can't:
- Is my brand being cited as a trustworthy source in AI-generated answers?
- What’s the general sentiment around my brand in these AI conversations?
- Which of my competitors are already seen as authorities by AI on my core topics?
By combining data from GSC, SERP trackers, and AI visibility platforms, you get a complete, 360-degree view of your entire digital footprint. This holistic approach ensures you aren’t just optimizing for yesterday's search engine but are building authority for tomorrow's entire information ecosystem.
The Essential Metrics That Actually Matter
Diving into SEO data can feel like trying to drink from a firehose. With dozens of metrics screaming for your attention, it’s easy to get lost in numbers that don’t actually move the needle. Let's cut through the noise and focus on what provides real, strategic direction.
Think of it like a car's dashboard. You've got a speedometer, a fuel gauge, and an engine light—your core indicators. You don't need to watch every single sensor to know if you're getting where you need to go. The same logic applies here. Mastering a few key metrics is far more powerful than glancing at dozens.
Visibility Metrics: The Foundation of Performance
Before anyone can click your link, they have to see it. Visibility metrics tell you how present your brand is on the search engine results page (SERP). This is the absolute top of your SEO funnel, and getting it right is the first step toward driving any traffic.
The most fundamental metric here is Keyword Position, or "rank." It’s a simple number telling you where your page shows up for a specific search. Position #1 is the goal, of course, but any spot on the first page (positions 1-10) is a major win.
But position alone is just one piece of the puzzle. You also need to track Impressions, which is the number of times your URL appeared in a search result for a user. High impressions mean Google is frequently showing your page, a sign that it considers you relevant for a topic, even if you aren't sitting at the very top.
- Keyword Position: Your direct rank for a search term. It’s your foothold on the SERP.
- Impressions: The number of times your link was displayed to users. This is the true measure of your overall visibility.
A page could have a lower average position but a massive number of impressions if it ranks for hundreds of related long-tail keywords. This combination often points to a high-value page with a ton of untapped potential.
Engagement Metrics: Gauging User Interest
Once you have visibility, the next question is simple: are you compelling enough to earn the click? Engagement metrics measure how users interact with your search listings, giving you direct feedback on your relevance and appeal.
The king of engagement metrics is the Click-Through Rate (CTR). This percentage shows how many people who saw your link (impressions) actually clicked on it. It’s an incredibly powerful signal of how well your title tag and meta description are hitting the mark with your audience.
A low CTR despite high impressions and a good position is a blaring alarm bell. It screams, "People see me, but they don't want to click!" This is your cue to rewrite your SERP snippet to be more enticing and better match user intent.
For example, if you rank #4 for "best running shoes for beginners" and get thousands of impressions but your CTR is a measly 1%, your competitors are doing a much better job of grabbing attention. Look at their titles—what are they doing that you aren’t? For a deeper dive, our guide on the key website metrics to track provides a more complete picture of performance.
To help you connect the dots between data and action, here’s a breakdown of the core metrics and what they should inspire you to do.
Key SEO Metrics and Their Strategic Implications
| Metric | What It Measures | Strategic Action |
|---|---|---|
| Keyword Position | Your page's specific rank for a search query. | Analyze & Optimize: Improve on-page SEO, build internal links, and target SERP features for keywords in striking distance (positions 4-15). |
| Impressions | How often your URL is shown in search results. | Expand & Capitalize: High impressions with low clicks? Rewrite titles/metas. High impressions for unexpected keywords? Create new, targeted content. |
| Click-Through Rate (CTR) | The percentage of impressions that result in a click. | Refine & Test: A/B test different headlines and meta descriptions to improve your value proposition and stand out from competitors. |
| SERP Feature Ownership | Your presence in non-traditional results like Featured Snippets. | Dominate the SERP: Structure content with clear Q&As, use lists, and add structured data to capture these high-visibility spots. |
| AI Citations | Mentions of your brand or content in AI-generated answers. | Build Foundational Authority: Create comprehensive, well-cited, and clear content that positions you as the definitive source for AI to reference. |
These metrics don’t exist in a vacuum. A high rank is great, but it’s the combination of visibility, engagement, and authority that truly drives growth.
Authority Metrics: Your Prominence and Trust
Ranking high is one thing, but modern SEO is also about dominating the SERP and building undeniable authority. These metrics go beyond a simple blue link, measuring how prominently you feature and how your brand is perceived across the entire information ecosystem.
One critical aspect is your presence in SERP Features. These are any results that aren't the traditional organic listings, such as:
- Featured Snippets (the answer boxes at the top)
- People Also Ask boxes
- Image Packs and Video Carousels
- Knowledge Panels
Securing these spots can dramatically boost your visibility and CTR, even if your traditional rank is a bit lower. They instantly position your brand as an authority. In an environment where nearly 60% of EU Google searches in 2024 resulted in no clicks, winning these direct-answer features is becoming a survival skill. This is all happening on a platform where Google holds 90.82% of the worldwide market, making that SERP real estate fiercely competitive. You can dig into more search engine market trends at Statcounter.com.
Beyond the SERP, a new set of metrics is emerging: AI Citations and Sentiment. These track how and when AI models like ChatGPT reference your brand or content. A positive citation in an AI-generated answer acts as a powerful endorsement, positioning you as a trusted source to a new wave of users getting their info from conversational AI. This is the new frontier of digital authority.
How to Turn Raw Numbers into Strategic Insights
Collecting SEO ranking data is just the first step. The real magic happens when you turn those raw numbers into a clear, actionable strategy that actually drives growth. Without a structured process, data is just a collection of interesting—but ultimately useless—figures.
This workflow is all about creating a repeatable routine to get from data collection to strategic execution. Think of it like a chef following a recipe. You start with raw ingredients (your data), follow a series of steps (analysis), and produce a final dish (a winning SEO strategy). This process ensures you consistently find your most important opportunities.
The following flowchart breaks down the core process of turning metrics into a cohesive strategy, moving from initial visibility to establishing real authority.
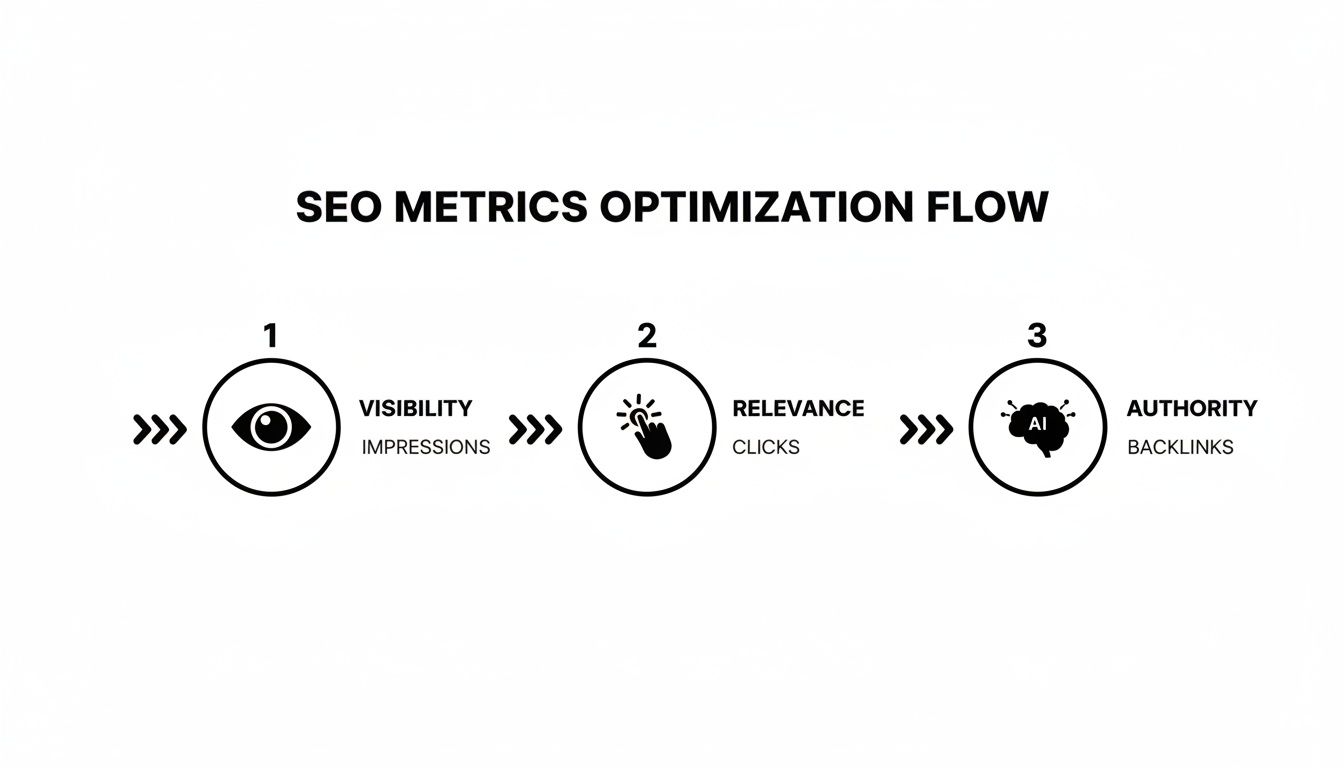
As you can see, a successful SEO strategy is built in layers. Each stage—Visibility, Relevance, and Authority—relies on the one before it to create sustainable growth.
Step 1: Consolidate Your Data Sources
First things first: you need to bring all your information into one place. This means pulling data from the different tools we've discussed, since each one provides a unique piece of the puzzle.
- Google Search Console: This is your ground truth for on-site performance. Export data on clicks, impressions, CTR, and average position for your most important pages and queries.
- SERP Trackers (e.g., Ahrefs, Semrush): Use these to gather competitive intelligence. What keywords are your rivals ranking for? What SERP features are they dominating?
- AI Visibility Tools (e.g., Sight AI): Pull data on AI citations and sentiment. This will show you how your brand is being perceived in the new AI-powered information ecosystem.
Gathering this data first gives you a complete picture of your performance, your competitors' moves, and your brand's authority across both traditional search and AI.
Step 2: Segment Your Data for Clarity
Staring at all your data at once is overwhelming. The key to finding real insights is segmentation—breaking down your data into smaller, more manageable chunks to spot patterns you would otherwise miss.
Imagine you're a geologist looking for gold; you don't sift through an entire mountain at once. You focus on specific areas where gold is likely to be found. Segmentation is the exact same idea, just applied to your SEO ranking data.
Here are a few effective ways to segment:
- By Page Type: Group your data for blog posts, product pages, and landing pages separately. A great CTR for a blog post might be a terrible one for a product page.
- By Keyword Intent: Analyze performance for informational ("how to..."), commercial ("best..."), and transactional ("buy...") keywords. This helps you align your content with what users actually want.
- By Device: Compare mobile versus desktop performance. A page might rank well on desktop but have a clunky user experience on mobile, killing its potential.
This targeted approach turns a noisy dataset into a clear map of your strengths and weaknesses.
Step 3: Benchmark Against Competitors and History
Context is everything. A 5% CTR might seem low on its own, but if your top three competitors are all hovering around 2%, you're actually leading the pack. Benchmarking gives your numbers meaning by comparing them against relevant standards.
Start by benchmarking against your own historical performance. This is how you identify trends. Are your rankings for a key topic cluster slowly declining? Is your overall organic traffic dipping month-over-month? Globally, organic traffic fell 5.92% between 2024 and 2025 as AI overviews and zero-click searches ate into traditional results. Without historical data, you wouldn't know if a drop is part of a larger trend or a problem specific to your site. This context is critical, especially when you consider that 90.63% of websites get zero traffic from Google—it shows just how difficult it is to succeed without a data-informed strategy.
Next, benchmark against your direct competitors. Pick 2-3 key rivals and analyze their performance for your target keywords. This process often uncovers some golden opportunities:
Is a competitor consistently winning the featured snippet for a high-value term? Analyze their page structure. They are likely using clear headings, bullet points, or numbered lists that Google loves—a tactic you can replicate.
This comparative analysis is where you find your biggest strategic advantages. It's not just about tracking your own numbers; it's about understanding where you stand in the competitive landscape.
For more tips on organizing this information, check out our guide on creating a clear SEO monthly reporting format. By following a structured workflow, you can move beyond simple data collection and start generating the kinds of strategic insights that produce measurable results.
A Case Study on Using Data to Drive Growth
Theory is great, but seeing it all come together in the real world is what really makes it stick. Let's walk through the journey of a fictional B2B SaaS company, "ConnectSphere," to see how they used SEO ranking data to smash through a frustrating traffic plateau and find a whole new way to grow.
ConnectSphere had been pouring resources into high-quality articles about project management. But for six long months, their organic traffic had flatlined. The team felt like they were just spinning their wheels, publishing content that disappeared into a void. They knew they needed to stop guessing and start diagnosing the problem with data.
Uncovering the Initial Problem
The team dove straight into Google Search Console, the most direct source of truth for their performance. Their first move was simple but powerful: they filtered their data to find pages with a ton of impressions but a disappointingly low click-through rate (CTR).
This one filter immediately lit up their core problem. Their flagship piece, "The Ultimate Guide to Agile Workflows," was pulling in over 50,000 impressions every month but had a dismal CTR of just 0.8%. People were seeing their link in the search results, but something was stopping them from actually clicking. The visibility was there; the engagement was not.
This single piece of seo ranking data was their first real clue. It wasn't a visibility issue—it was an appeal issue, happening right on the search results page.
Digging Deeper with Competitive Data
Now that they knew the what, they needed to figure out the why. Why weren't people clicking? To find out, they fired up a third-party SERP tracker to get a good look at the competitive landscape for their main keyword, "agile workflow guide."
The results were an eye-opener. The top three competitors all had one thing in common: their pages owned the featured snippet. ConnectSphere's guide, despite ranking on page one, was just a standard blue link drowning below a massive, attention-grabbing answer box. On top of that, the competitors' titles were more compelling, using action-oriented phrases like "Master Agile in 7 Steps" instead of ConnectSphere's passive "Ultimate Guide."
This is a classic example of how raw data leads to a strategic insight. The low CTR from Search Console combined with the SERP analysis revealed a clear path forward: optimize the page structure to capture the featured snippet and rewrite the title to be more compelling.
Armed with this insight, they got to work restructuring their guide with clear, numbered steps and a snappy Q&A section right at the top—perfect bait for the snippet.
The Breakthrough with AI Visibility
While they were making these on-page fixes, the team decided to explore a new layer of data: AI visibility. Their target audience was using tools like ChatGPT more and more for research, and they wanted to know if their brand was even part of that conversation.
Using an AI visibility tool, they found something shocking. Their main competitor wasn't just winning in traditional search; they were also being cited as the go-to source in AI-generated answers for dozens of questions about agile workflows. ConnectSphere? They had zero mentions.
This was the real breakthrough. It showed them that their competitor wasn't just seen as relevant by Google's algorithm, but as a foundational authority by the AI models themselves. This insight triggered a complete overhaul of their content strategy.
They stopped just tweaking old pages and launched a massive content pillar around "AI in Project Management." They used an SEO automation platform to rapidly research, outline, and produce a web of interconnected articles designed to cement their expertise in the space.
The results were game-changing. Within three months, their new content pillar started to rank, they finally snagged the featured snippet for "agile workflow guide," and—most importantly—their brand began popping up in AI-generated answers. By weaving together traditional seo ranking data with modern AI insights, ConnectSphere didn't just break their plateau; they opened up a powerful new channel for growth.
Common Data Analysis Pitfalls to Avoid
Having a flood of SEO ranking data can feel like a superpower, but it's a classic double-edged sword. Without a sharp, critical eye, this data can easily send you chasing ghosts, wasting precious time and resources on tactics that just don't move the needle. Knowing what not to do is just as important as knowing what to do.
One of the most common traps is getting hooked on vanity metrics. Sure, celebrating a massive spike in impressions for a broad, high-volume keyword feels great. But if that keyword has a 0.1% CTR and drives zero conversions, it's just noise. Real success is measured by metrics tied directly to business goals, like qualified leads or actual sales from your organic traffic.
Another critical mistake is misunderstanding user intent. For example, trying to rank for a monster keyword like "project management" is a huge undertaking. If your product is actually for a very specific niche, like "project management for small creative agencies," winning the broader term will likely attract the wrong people, leading to sky-high bounce rates and dismal engagement.
Mistaking Correlation for Causation
This is a big one. It's the classic trap of assuming that just because two things happened around the same time, one must have caused the other. You might notice your rankings for a keyword group shot up right after you redesigned your homepage.
But was it the redesign? Or was it the three high-authority backlinks you happened to earn that same week? If you credit the wrong action, you'll end up pouring money into repeating a strategy that never actually worked in the first place.
Always hunt for confounding variables before you declare victory. Try to isolate changes when you're testing, and always cross-reference multiple data points—like referral traffic, backlink acquisition dates, and major algorithm updates—to get the real story of what's driving performance.
Ignoring Data Segmentation and Quality
Finally, treating all your data as one giant, uniform blob is a recipe for disaster. Averages are incredibly deceptive. An overall site CTR of 3% might sound okay, but it could be hiding a huge story: your blog posts might have a stellar 8% CTR while your mission-critical product pages are dying on the vine at 0.5%.
Without slicing up your data, you'd miss both the massive win and the five-alarm fire. Similarly, poor data quality will poison your analysis from the start; look into strategies for improving data quality to make sure your insights are built on a solid foundation. Always segment your data by page type, device, country, or any other relevant dimension to uncover the truth hidden inside the numbers.
Frequently Asked Questions About SEO Ranking Data
Jumping into the world of SEO data can bring up a lot of questions. We get it. Let's tackle some of the most common ones to help you move from knowledge to confident, strategic action.
How Often Should I Check My SEO Ranking Data?
Honestly, the right answer depends entirely on your goals and what you're tracking. There's no single magic number. A tiered approach usually works best.
- Daily or Weekly: This is for your mission-critical stuff. Keep a close eye on your highest-value keyword positions and overall site health. A daily or weekly check-in lets you spot sudden drops or technical glitches before they become major problems.
- Weekly or Bi-weekly: This cadence is perfect for digging into core content performance metrics like CTR and impressions. It gives you just enough data to see real trends forming without getting lost in the noise of daily fluctuations.
- Monthly or Quarterly: Zoom out for the big picture. This is your time for strategic reviews and seeing how you stack up against the competition. Use this data to track long-term growth, spot larger market shifts, and plan your next big moves.
The key is consistency. Whatever schedule you choose, stick to it. Make sure it aligns with your business goals so the time you spend is always productive.
What Is the Difference Between SEO Data and AI Visibility Data?
Think of it like this: SEO ranking data is your report card from traditional search engines like Google. It’s the classic stuff—keyword positions, clicks, impressions. It tells you exactly how you're performing on the SERP.
AI visibility data, on the other hand, is a new and vital piece of the puzzle. It measures how your brand shows up in answers from generative AI models like ChatGPT. It's not about your rank; it's about whether you're cited as a source and the sentiment of those mentions. Using both gives you a complete picture of your authority across the entire information ecosystem.
SEO data tells you how you perform in search results. AI visibility data tells you if you're considered a trusted source in the emerging world of conversational AI.
Can I Use Just One Tool for All My SEO Data?
While it's tempting to find that one "do-it-all" platform, relying on a single tool is a great way to develop some serious blind spots. The reality is that a multi-tool approach gives you a much more accurate and complete view of what's really happening.
The best approach is to build a small, powerful toolkit. Use Google Search Console for undeniable, first-party data on your site's performance. Layer in a third-party tool like Ahrefs for deep competitive intelligence. And finally, add an AI visibility platform to get crucial insights into where the world of search is heading. This creates a well-rounded data ecosystem that’s built for modern SEO.
Ready to see how your brand shows up in AI conversations? Sight AI monitors your AI visibility, uncovers high-value content gaps, and uses specialized AI agents to generate SEO-optimized articles that drive growth. Transform insights into action at https://www.trysight.ai.
