
A great SEO monthly reporting format is all about telling a story—one that connects your work to real business outcomes, not just a list of numbers. It’s about translating complex data into a clear narrative: what happened, why it happened, and what we’re doing next to keep the momentum going. This approach turns a boring, static document into a powerful tool for strategy and decision-making.
Why Your Current SEO Report Isn't Working

Let's be honest—most SEO reports are DOA. They land in an inbox, get a quick scan, and are promptly archived without making any real impact. Why? Because they almost never answer the one question every stakeholder actually cares about: "So what?"
These ineffective reports are usually just data dumps. They’re packed with vanity metrics that look impressive on the surface but mean nothing without business context. Focusing only on rankings or traffic spikes without tying them to conversions, leads, or revenue is a classic mistake. A traditional report might celebrate jumping from position #5 to #3 for a keyword, but it completely fails to explain if that shift generated a single new lead. You can learn more about why context is so critical in our guide explaining what is rank tracking.
From Data Dump to Strategic Narrative
The core problem is a failure to tell a cohesive story. An effective SEO monthly reporting format isn't about listing numbers; it's about building a strategic narrative that executives can actually understand and get behind. It’s about framing SEO performance in the language of business growth.
Think about these common pitfalls that make reports totally useless:
- Overlooking Conversion Data: A report showing a 20% traffic increase is only half the story. Did that new traffic convert? Was it high-quality? Without this data, traffic is just a number.
- Rankings Without Context: Celebrating keyword rankings is pointless if those keywords don't drive valuable traffic or if the searcher's intent doesn't line up with business goals.
- Lack of Actionable Insights: A good report needs to clearly state what happened, why it happened, and what the team is going to do next. Without that "next steps" piece, it's just a history lesson.
The most valuable SEO reports are forward-looking. They use past performance not just to celebrate wins, but to justify the next strategic move, secure budget, and get the whole team aligned on what matters.
Shifting the Conversation to Business Outcomes
If you want to create reports that get read, respected, and acted upon, you have to shift the focus from activity metrics to outcome metrics.
Stop just showing "Organic Traffic" and start showing "Leads Generated from Organic Search." Instead of just listing backlinks, show how they contributed to "Increased Domain Authority and Referral Traffic."
This fundamental change in perspective transforms your report from a technical update into a C-suite-level strategic document. It proves that SEO isn't just another line item on the marketing budget—it's a primary driver of revenue and sustainable business growth.
Gathering the Data That Truly Matters
A powerful report isn’t built on a mountain of data; it's built on the right data. To create an SEO report that actually gets read and valued by stakeholders, you need to go beyond the surface. Forget the fluff. We're focusing on the Key Performance Indicators (KPIs) that tie your search performance directly to the business's bottom line.
This is all about changing the conversation from "how much traffic did we get?" to "what did that traffic do for us?" The real win isn't just a spike in visitors; it's about the quality of those visitors and the actions they took. A huge part of this is knowing how to track visits to a website effectively, as that data is the foundation for everything else you'll report on.
Ditching Vanity Metrics for Business KPIs
First things first: you have to define what a "win" actually looks like for the business. Is it more e-commerce sales? A steady stream of qualified B2B leads? Maybe it’s just about dominating the conversation around a specific topic. Whatever the goal, your KPIs must reflect it.
Here are the kinds of metrics that really move the needle:
- Organic Conversion Rate: This is the big one. It’s the percentage of visitors from organic search who actually did the thing you wanted them to do—buy a product, fill out a form, subscribe. It’s the ultimate measure of whether your traffic is any good.
- Lead Quality from Search: For B2B companies, not all leads are created equal. You need to track how many Marketing Qualified Leads (MQLs) or Sales Qualified Leads (SQLs) came from organic search. This is how you prove SEO is directly feeding the sales pipeline.
- Branded vs. Non-Branded Traffic: Watching this trend tells a story about your brand's health. A steady rise in non-branded traffic is a huge win—it means your SEO strategy is successfully pulling in new people who weren't already looking for you by name.
- Share of Voice (SOV): This KPI gives you a realistic picture of your visibility for a core set of keywords compared to your competitors. It answers the question, "How much of the conversation do we own?"
When you focus on these metrics, you can build a narrative around real business value, not just traffic figures. For a deeper dive into which numbers to prioritize, check out our guide on the https://www.trysight.ai/blog/key-website-metrics-to-track. This strategic approach is what turns a report from a simple update into a document that commands attention.
Assembling Your Data Toolkit
To pull these kinds of insightful metrics, you can't rely on a single tool. A comprehensive report requires data from a few different places, each giving you a unique piece of the puzzle. Think of it as assembling a small but mighty toolkit.
An effective SEO report isn't about using the most tools; it's about using the right tools to tell a clear, cohesive story about performance and its direct impact on business goals.
Let's look at the essential platforms and what they each bring to the party.
Essential SEO KPIs and Their Primary Data Sources
Here's a quick-reference guide to the metrics that matter most and the best tools for tracking them down. This table should help you build a solid workflow for gathering everything you need each month.
| Metric Category | Specific KPI | Primary Tool(s) | Why It Matters |
|---|---|---|---|
| Traffic & Engagement | Organic Sessions, New Users, Bounce Rate | Google Analytics 4 | Provides the foundational view of who is visiting your site from search and how they are interacting with your content. |
| Search Visibility | Impressions, Clicks, Average Position | Google Search Console | Offers direct insight into how Google sees your site, which queries drive traffic, and your performance in the SERPs. |
| Competitive Analysis | Keyword Rankings, Share of Voice | Semrush, Ahrefs | Allows you to benchmark your performance against competitors, identify new opportunities, and understand market trends. |
| Technical Health | Crawl Errors, Site Speed, Core Web Vitals | Screaming Frog, GSC | Ensures your website is technically sound, providing a strong foundation for all other SEO efforts to succeed. |
| Business Outcomes | Organic Conversions, Assisted Conversions | Google Analytics 4 | Directly connects your SEO activities to tangible business results like revenue, leads, and sign-ups. |
By pulling data from each of these sources, you get a well-rounded view of performance—from high-level traffic trends down to the nitty-gritty of technical health and competitive positioning.
Building a Repeatable Data Gathering Process
Your reporting process needs to be efficient and repeatable. A standardized workflow saves you a massive amount of time and ensures you don't miss anything important month to month. Think of it as your pre-flight checklist.
A streamlined process isn't just about saving time; it's about making better decisions, faster. Teams with a standardized reporting format often see a jump in strategic agility. Some studies show decision-making can be up to 40% faster when the data is presented consistently. When campaigns are humming, it's not uncommon for these reports to show MoM organic traffic growth of 15-25%. The best reports get the key takeaways—like traffic changes and conversions—across in under a minute.
Creating this workflow doesn't have to be complicated. Just make a simple checklist of what data to pull from which source every month. This simple, methodical approach guarantees your report is built on a solid foundation of accurate data, every single time.
How to Structure a Report That Tells a Story

Let's be honest: nobody wants to read a data dump. The best SEO reports I've seen don't just list metrics; they weave them into a narrative that makes sense. A truly effective seo monthly reporting format is structured like a good story, with a clear beginning, a detailed middle, and a forward-looking conclusion. This approach is what turns a dry document into a strategic roadmap that stakeholders can actually understand and act on.
The whole point is to answer three simple but critical questions for every single piece of data you present:
- What happened? A quick, clear summary of the performance.
- Why did it happen? The analysis and insights that explain the numbers.
- What are we doing next? The specific, actionable steps based on what you found.
Framing your report this way turns it from a passive update into a powerful tool for driving strategy. It's how you build a solid case for your work and justify future investment.
Start With a Powerful Executive Summary
Your stakeholders are busy people. The Executive Summary is hands-down the most critical part of your report because, for some, it might be the only section they read. It needs to cut to the chase and deliver the bottom line in seconds, giving a high-level overview of the month's performance and key outcomes.
This summary should be brief, direct, and laser-focused on business impact. Ditch the SEO jargon and get straight to what matters.
For example, instead of saying, "Organic sessions increased by 12% MoM," try something with more punch: "Our new content strategy drove a 12% increase in organic traffic this month, resulting in a 7% uplift in qualified marketing leads and contributing an estimated $15,000 in pipeline value." See the difference? You've immediately connected SEO activity to tangible business results.
The Executive Summary sets the entire tone for the report. Think of it as a concise highlight reel of your biggest wins, key challenges, and the overall strategic direction. It needs to be a perfect, standalone snapshot of the month's SEO story.
Detail the Organic Performance Analysis
After the summary, it's time to dig into the core performance data. This is where you back up the claims you made in the intro with hard evidence. The absolute key here is context—never, ever present a number without a point of comparison.
The two most important comparisons you need to show are:
- Month-over-Month (MoM) Growth: This shows your short-term momentum and the immediate impact of recent work, like a new content push or a technical fix.
- Year-over-Year (YoY) Growth: This gives a much clearer picture of long-term progress by smoothing out any seasonal bumps and proving sustained growth.
A great way to present this is with a clean table or dashboard view showing metrics like organic sessions, users, and conversions with both MoM and YoY percentage changes. This visual format makes trends pop. Right after the data, add your commentary—the "why"—to explain what's happening. For instance, you could point out that a YoY traffic increase of 45% was primarily driven by the success of blog content published in the last six months.
Uncover Keyword and Content Insights
This is where you bridge the gap between performance data and the actual content and keywords doing the heavy lifting. It's your chance to show what's really resonating with your audience and where the biggest opportunities are hiding. Don't just dump a list of top-ranking keywords; group them into meaningful clusters that tell a story.
I like to create a section for "High-Impact Content" that highlights the top 5-10 blog posts or landing pages that brought in the most organic traffic or conversions. For each one, add a short note on why it succeeded. Was it a perfectly timed topic? Did it finally rank for a high-intent keyword cluster?
Do the same for "Keyword Opportunity Insights." Pinpoint keywords where you've seen major positive movement or new terms that are just starting to generate impressions. Frame these as strategic opportunities.
Example Insight
"Our new guide on 'enterprise project management' finally broke into the top 10 this month and is now driving 500+ new sessions per week. To build on this, we'll create supporting articles next month targeting related long-tail keywords to establish a strong topical cluster."
Evaluate Your Backlink and Technical Health
A truly comprehensive report looks beyond traffic and keywords to the foundational pillars of SEO. Including these sections shows that you're managing the long-term health and authority of the website, not just chasing quick wins.
For the Backlink Profile Health section, there's no need to list every single new link. A summary is much more effective:
- Total number of new referring domains acquired.
- Highlight a couple of the most authoritative or relevant new links.
- Mention any specific link-building campaigns that really paid off.
The Technical SEO Status section reassures everyone that the website's foundation is solid. This is where a detailed site audit comes in handy—you can actually reference our guide for an excellent seo audit report sample to see what a deep dive looks like. For a monthly report, though, a high-level summary is perfect.
Include key vitals like:
- Core Web Vitals performance (pass/fail).
- Any significant spikes or drops in crawl errors.
- The status of major technical projects, like a site migration or schema implementation.
This part of the report proves you're proactive, catching and fixing issues before they can drag down performance. It builds confidence that you're not just a marketer, but a true steward of the website's organic future.
Streamlining Your Workflow with Automation
Let's be honest: spending hours every month manually pulling data from Google Analytics 4, Search Console, and your go-to SEO tool is a massive waste of your strategic brainpower. The real goal isn't just to produce a report; it's to find the story hidden in the data. Automating the grunt work of your seo monthly reporting format is how you claw back the time you desperately need for high-level analysis.
This isn’t about letting robots take over—it's the complete opposite. It’s about letting technology handle the tedious data aggregation so you can finally focus on what you were hired for: crafting the narrative, spotting opportunities, and making smart recommendations. Tools like Looker Studio or the built-in reporting features in platforms like Semrush are perfect for this.
Building Your Automated Dashboard
Your first move should be creating a dynamic dashboard that acts as your single source of truth. The idea is simple: connect all your essential data sources—GA4, Google Search Console, Ahrefs, Semrush—into one cohesive view that updates on its own. Looker Studio is an excellent, and free, place to start.
Connecting your Google properties is pretty straightforward. For third-party tools like Semrush or Ahrefs, you might need a connector like Supermetrics to pipe that data into your dashboard.
Your main objective here is to build a template that visualizes the core KPIs we've already covered:
- Organic Traffic Trends: Use line charts to show month-over-month and year-over-year session growth.
- Conversion Tracking: Display simple scorecards for organic goal completions and conversion rates.
- Keyword Visibility: Create tables that highlight your top-performing non-branded keywords.
- Technical Health: A simple status indicator for Core Web Vitals or crawl errors will do the trick.
Once this template is built, the heavy lifting is done. Each month, the data refreshes automatically. All you have to do is analyze the results and add your expert commentary.
The real power of automation isn't just saving time; it's enforcing consistency. When stakeholders see the same clean, professional visuals every month, it builds trust and makes complex data much easier to digest.
The Smart Way to Use Automation
Think of automation as handling about 80% of your reporting process—the data collection and visualization. The other 20% is where you, the expert, add the irreplaceable human element of insight and strategy. An automated report without analysis is still just a data dump.
When you look at the time saved, it's a no-brainer. Creating a solid SEO monthly report manually can take anywhere from 3 to 5 hours. With an automated dashboard in Looker Studio or Semrush, you can slash that time to under 30 minutes. That's a game-changer for content marketers and SaaS growth teams juggling a dozen campaigns. In fact, agency surveys show that 73% of SEO professionals who use automated templates report higher client retention, simply because interactive charts make complex data easy to understand.
Here’s what your new, smarter workflow should look like:
- Data Auto-Refreshes: At the start of the month, your Looker Studio dashboard populates with the latest numbers.
- You Analyze and Annotate: You review the trends, spot anything unusual, and start forming your hypotheses.
- Add Your Narrative: Finally, you export key charts or use the dashboard as a foundation, adding a detailed Executive Summary and section-by-section commentary explaining what happened, why it happened, and what’s next.
This hybrid approach gives you the best of both worlds: the speed and accuracy of machine-powered data aggregation paired with the strategic depth of human analysis. To really dial in your workflow, exploring the best SEO ranking reporting software can help you find the perfect platform for your specific needs.
From Manual Labor to Strategic Oversight
Ultimately, the right automation transforms your role from a data puller to a data strategist. It frees you from the drudgery of copy-pasting numbers into spreadsheets and lets you spend your valuable time on the work that actually moves the needle: analyzing performance, spotting competitive gaps, and planning your next moves.
For those looking to take this even further, a dedicated SEO automation platform can manage not just reporting but also content creation and distribution, compounding your efficiency gains across the board.
Presenting Your Findings for Maximum Impact
You've built the perfect report. The data is clean, the KPIs are spot-on, but none of it matters if the message doesn't land. The final step—and honestly, the most crucial one—is the presentation. This is where you turn all those numbers into actual business decisions and secure the buy-in your SEO strategy needs.
Let's be real: raw numbers don't inspire action. A compelling narrative does.
The first rule of presenting is to know who's in the room. Your delivery to the C-suite should sound completely different from your tactical deep-dive with the marketing team. For executives, you have to get straight to the point and connect everything to the bottom line.
Tailoring Your Narrative to the Audience
For C-suite stakeholders, your Executive Summary is everything. Keep it high-level, laser-focused on outcomes that tie directly back to business goals.
- Executive Focus: "Our SEO efforts generated $45,000 in new sales pipeline this month. That's a 15% increase year-over-year, driven by our success in capturing high-intent keywords."
- Marketing Team Focus: "We saw a 22% month-over-month traffic increase to the new '/features' landing page after updating the meta descriptions and internal linking structure. Let's break down how we can replicate this for other key pages."
See the difference? This targeted approach makes sure your message resonates. Executives hear about ROI, while your team gets concrete, actionable insights they can use to improve their work. For a deeper look into connecting your work to financial outcomes, our guide on measuring content marketing ROI is a fantastic resource.
The Power of Data Visualization
We're all visual creatures. A complex trend that takes three paragraphs to explain can be understood in seconds with the right chart. Good visualization isn't just about making your report look pretty; it's about making it immediately understandable.
Use simple, clean visuals to hammer home your most important points:
- Line charts are perfect for showing traffic or conversion trends over time.
- Bar graphs are great for comparing performance, like branded vs. non-branded traffic.
- Pie charts can quickly show the distribution of traffic sources.
This simple flow chart really captures the essence of effective reporting—turning raw data into actionable steps.
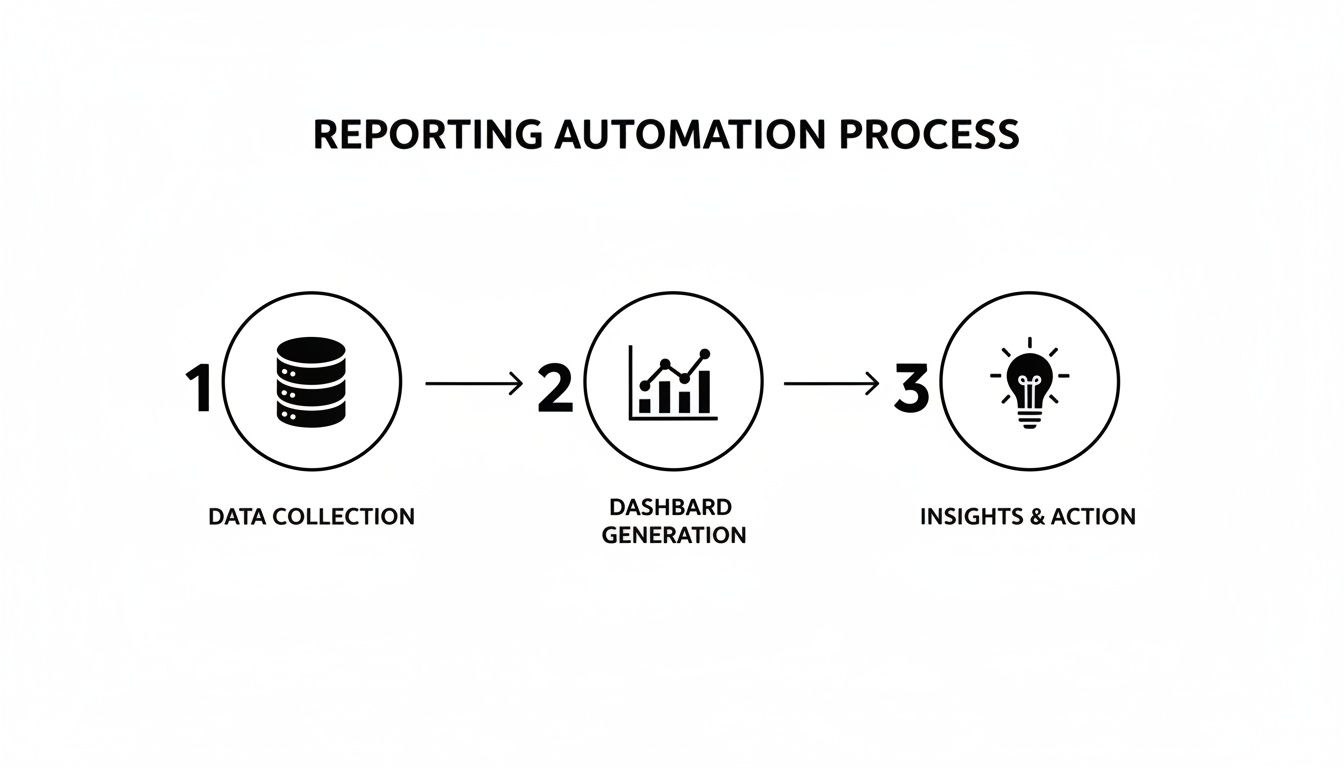
It highlights that data is just the starting point. The real value comes from transforming it into dashboards that surface clear insights, which then lead to smart actions.
Never just throw a chart on a slide and move on. Your job is to be the guide. Point out the story the data is telling and connect it directly to your strategic recommendations.
Proposing Strategic Recommendations with Confidence
Your presentation should always end with a clear, forward-looking action plan. This is where you pivot from reporting on the past to actively shaping the future. Based on everything you've just shown, what should the business do next?
Be specific and be confident. Don't just say, "We should create more content."
Instead, propose something like this: "Based on the clear success of our long-form guides, I recommend we allocate budget to produce two new comprehensive articles next month. We should target the 'supply chain optimization' keyword cluster, which has high commercial intent and a clear path to conversion."
This approach shows you're not just a data analyst; you're a strategic leader. By confidently presenting a clear path forward, you make it incredibly easy for stakeholders to say "yes" and ensure your SEO efforts continue to drive real, meaningful growth.
The Future of SEO Reporting Is Already Here
The world of search is moving at a blistering pace, and our reports have to keep up. Let's be honest, the static, rearview-mirror reports we used to build are quickly becoming relics. The future of the SEO monthly reporting format is dynamic, predictive, and woven directly into the fabric of the business. It’s no longer enough to just show what happened; we have to start painting a clear picture of what’s coming next.
This shift means looking beyond the familiar territory of traditional search engines. The explosion of generative AI like ChatGPT and Gemini has carved out an entirely new channel for discovery. Your brand's visibility isn't just about where you rank on Google anymore; it’s about how these AI models talk about you.
Integrating AI Visibility Metrics
This is the new frontier. Forward-thinking reports are already carving out sections for "AI Visibility." This means actively tracking how your brand, products, and services are portrayed in the answers these AI models generate. It's about getting ahead of the critical questions that stakeholders are just now beginning to ask.
So, what should you be tracking here?
- Prompt Mentions: How often does your brand pop up when users ask relevant questions?
- Sentiment Analysis: When the AI talks about you, is the tone positive, neutral, or negative?
- Citation Tracking: Is your original research and content being cited as a source in AI-generated answers? This is a huge indicator of authority.
Monitoring this isn't just a vanity metric; it’s a leading indicator of your brand’s authority in a rapidly growing ecosystem. It's proactive reputation management where millions of people are now turning for information.
Connecting SEO to Core Business KPIs
Here’s where the real evolution is happening. We're finally moving from purely marketing metrics to C-suite metrics. Sure, organic traffic and conversions are still vital, but the next generation of reports ties SEO performance directly to the financial health of the business. This is how you stop being seen as "the SEO person" and start being seen as a core driver of the company's bottom line.
The ultimate goal is to reframe the SEO conversation from "How much traffic did we get?" to "How did organic search contribute to profitable, long-term customer relationships?"
Instead of just reporting on lead volume, we're now analyzing the Customer Acquisition Cost (CAC) for the organic channel. How does our CAC stack up against paid search or social? This puts the efficiency and ROI of your SEO investment in stark, undeniable terms.
Even more powerful is the link to Customer Lifetime Value (CLV). By tracking cohorts of customers brought in through organic search, you can prove that SEO attracts not just any customers, but high-value, loyal ones who stick around and spend more over time.
Looking ahead, SEO monthly reporting formats are being reshaped to put these business-aligned KPIs front and center, especially as AI continues to disrupt everything. A recent analysis shows that 70% of businesses now report higher ROI from AI-integrated SEO—a significant jump from 52% just two years ago. This is driven by tying metrics like search visibility and conversion rates directly to revenue.
Modern reports now feature Organic Traffic Overviews with crystal-clear MoM/YoY comparisons. While global campaigns average 22% growth, we’re seeing AI-enhanced strategies, often powered by platforms like Sight AI, hit 38% by intelligently filling critical content gaps. For a deeper dive into these shifts, you can explore more insights on AI's impact on SEO reports.
SEO Reporting FAQs
Even with the best templates in hand, you're bound to run into a few questions when you start building your SEO reports. Let's tackle some of the most common ones I hear.
How Often Should You Send an SEO Report?
While a monthly report is pretty standard, the right frequency really comes down to who you're talking to. The trick is to match your reporting cadence to their decision-making needs.
- Weekly Snapshots: These are perfect for fast-paced projects or high-touch clients. Think quick updates on core metrics like traffic and conversions to keep everyone in the loop.
- Monthly Reports: This is the sweet spot for most marketing teams. It gives you enough data to spot real trends without drowning everyone in numbers.
- Quarterly Reviews: Save these for the C-suite. Executives don't need the weekly play-by-play; they need a high-level summary of strategic progress and long-term ROI.
What Is the Most Important Metric to Include?
If you could only show one number, it would be organic conversions. This is the metric that connects all your SEO work directly to business results—sales, sign-ups, leads, you name it.
Sure, traffic and rankings are important leading indicators, but conversions are what prove the actual value of your work. It's the number that resonates with leadership and makes the case for continued investment in SEO.
A report showing a 15% increase in sales from organic search will always land better than one that just shows a 20% rise in traffic.
How Should You Report a Drop in Traffic?
Always, always address performance dips head-on. Don't try to bury bad news; that's the fastest way to lose trust.
First, call out the drop right in your executive summary. Then, give a clear, concise diagnosis of what you think happened. Was it a Google algorithm update? A technical glitch? Maybe just seasonality or a competitor making a big move?
Finally, present your action plan. Detail the exact steps you're taking to investigate and fix the problem, and give them a realistic timeline for recovery. This turns a negative into a positive, showing you're a proactive expert who can handle anything that comes your way.
Ready to turn AI visibility insights into measurable growth? Sight AI monitors how AI models talk about your brand and uses that data to generate high-ranking content automatically. Stop guessing and start growing. Discover what Sight AI can do for you.